Venture Capital
The LTV Estimate Gamble
“Our customer LTV is $1,500”
“Our LTV:CAC is 7X”
“Our Payback Period is 8 months”
For the most part, these metrics — largely due to how they are typically derived — do not accurately reflect historical performance. As a result, they are poor metrics for predicting the future of a business.
Where Traditional LTV Estimates Go Wrong
Most businesses estimate a customer’s Lifetime Value (the cumulative value of gross profit generated by one customer) by taking historical Average Revenue Per Account (ARPA) Per Month and multiplying it by the Gross Margin % and then multiplying that by an estimate of the number of months they think a customer will stick around.
LTV = ARPA Per Month x Gross Margin x the # of Months a Customer is Active
There are two problems with this method:
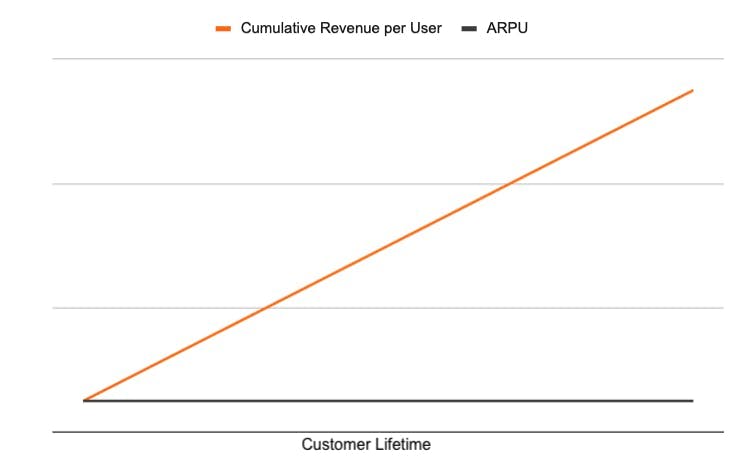
- LTV estimates apply linear revenue models rather than a true cash-flow oriented model. This is how the math above works:
Illustrative inaccurate linear LTV projection
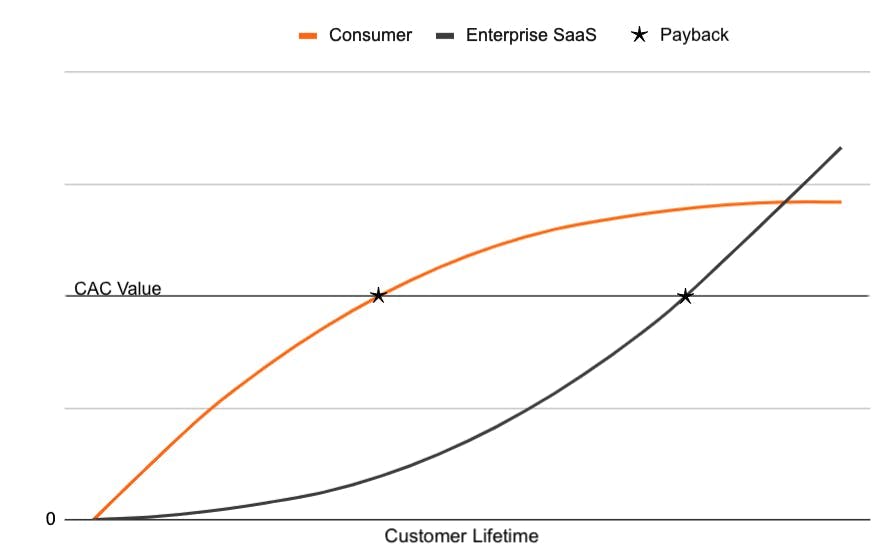
Consumers do not spend money in a linear fashion, which is how almost all LTV estimates build up their gross margin. The build-up of gross profit is mission-critical, as it has a major impact on one’s payback period. Should customers spend more at the beginning and less at the end, then maybe one’s payback period is shorter. It can also be the inverse (such as for enterprise software businesses), wherein a business may generate the bulk of its revenue in its latter years.
Illustrative overview of the difference between consumer and enterprise transactions over time
2. Cohort Blending: Even if you adjust for cash-flows, businesses tend to blend ARPA and Monthly Churn rates across all cohorts (For this discussion, a cohort is defined as a group of customers acquired within a certain time period. It can be a certain week, a month, a quarter, etc.).
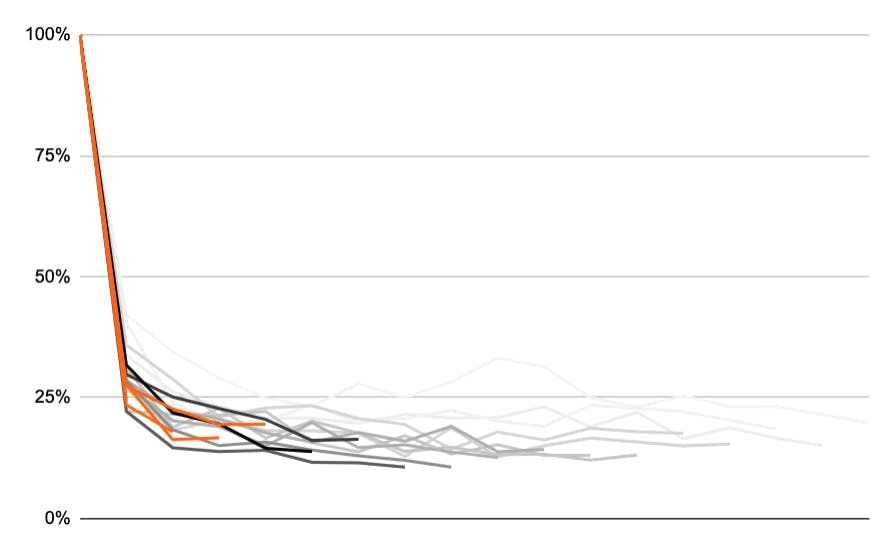
Due to this cohort blending, cohort improvement and degradation are not taken into account soon enough. Businesses deploy sales and marketing dollars (their Customer Acquisition Costs) against an estimated LTV, so it needs to be up-to-date. Below is an illustration of how consumer cohorts typically play out. As can be seen, there is quite a bit of variance in every cohort.
Illustrative Revenue Retention Based Cohort Analysis Example
How We Recommend Solving This Problem?
The most conservative approach here is to only look at realized LTV. What does this mean? If you only have 9-months of data, then only look at the customer spending of those 9-months. Most consumer businesses have the most LTV per month per customer at the beginning, so add up the cumulative gross margin of those customers to see what the realized LTV is. You need to take raw transaction data and build cohorts out of it. Link to how to build in Excel.
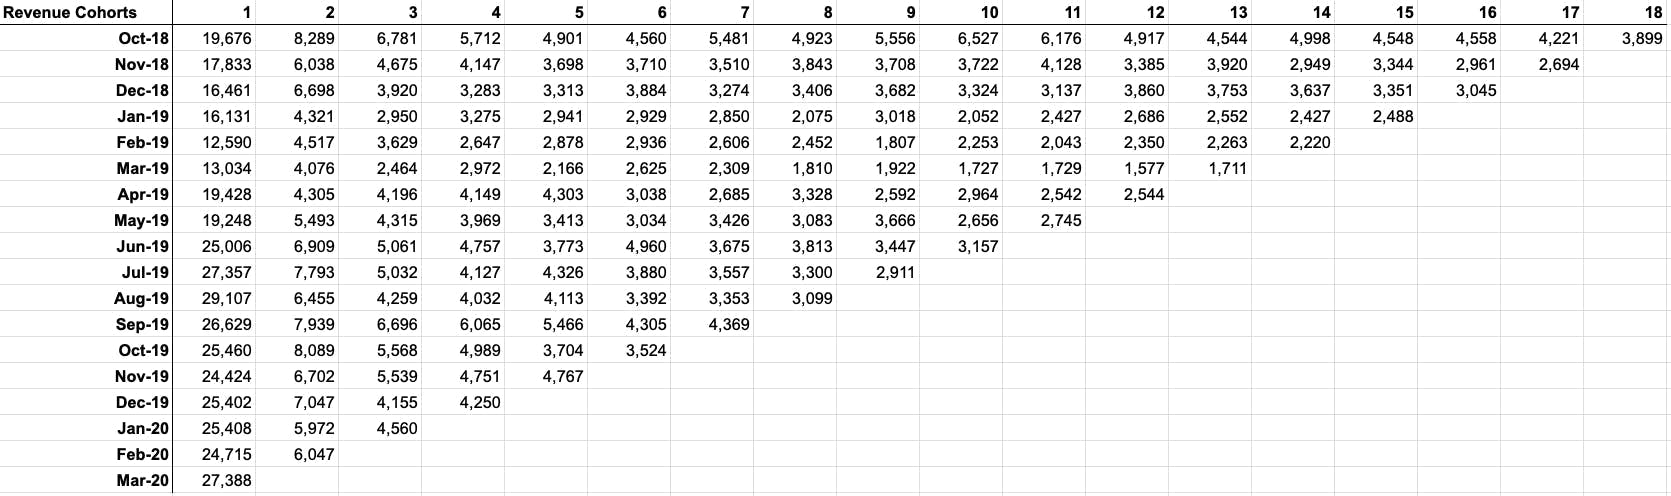
Below is an example of a revenue-based cohort analysis. In order to see each cohort by its LTV, just make each cell cumulative. Once multiplied by your gross margin, you have your true realized customer lifetime value. In order to be more accurate, you can also apply gross margins on a historical basis per month.
Illustrative Revenue Based Cohort Example
Analyze All Cohort Groups On A Monthly Basis
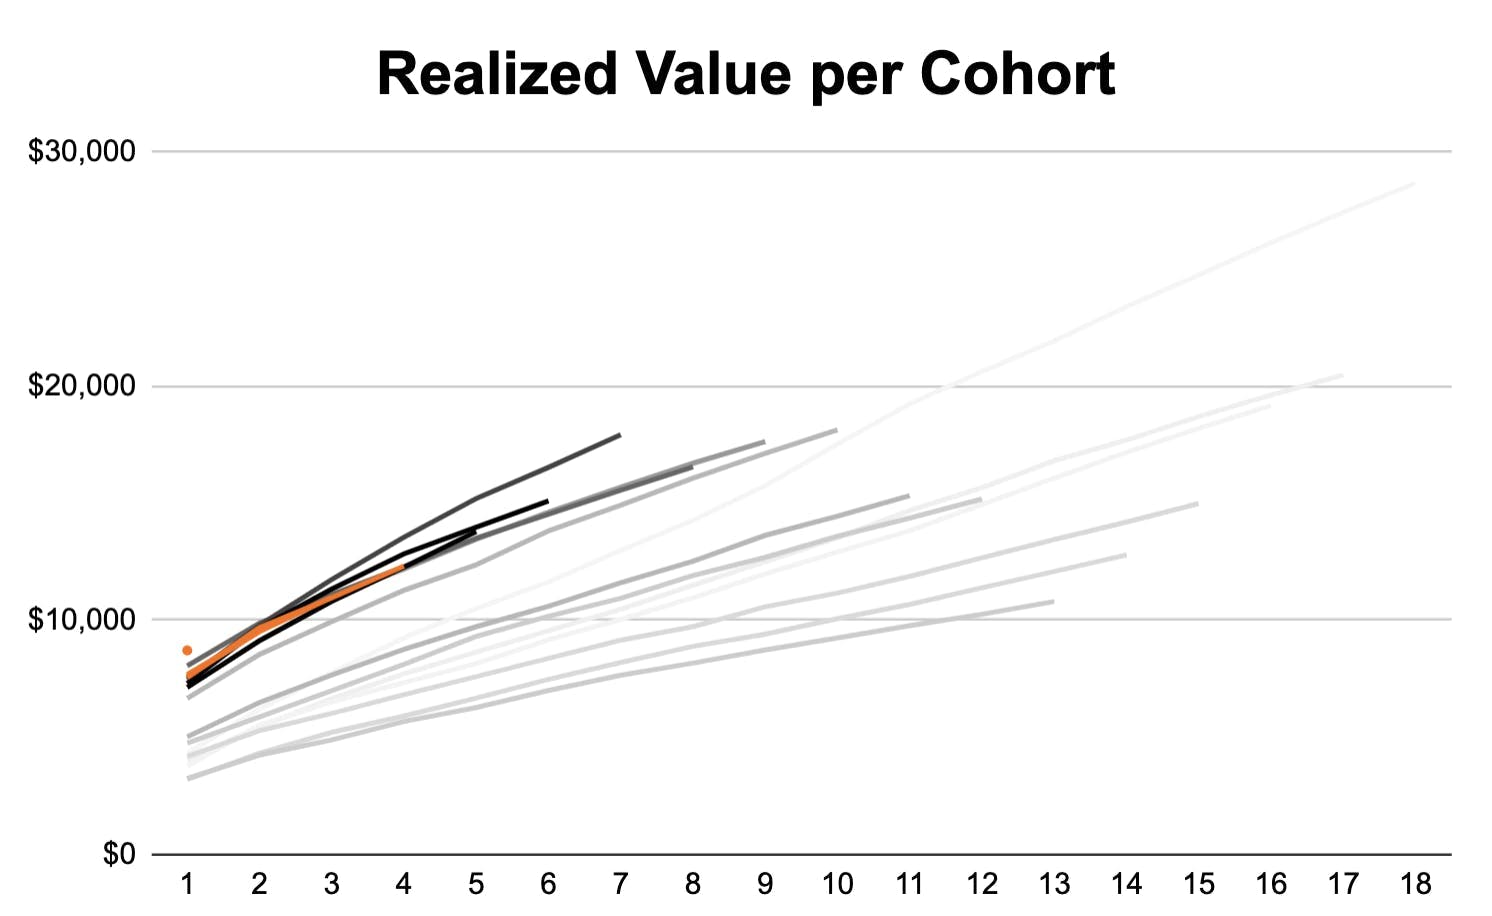
Every single group of customers is different. A company needs to evaluate each cohort on a Realized Value (or Cumulative Gross Profit) basis each month.
As can be seen below, one can quickly see how each cohort is doing in relation to its peers on a Realized Value basis. The next step is to see how well each cohort is performing on a relative basis.
Illustrative Realized Value per Cohort
Core Ratio: Comparing Cohort Performance On A Relative Basis
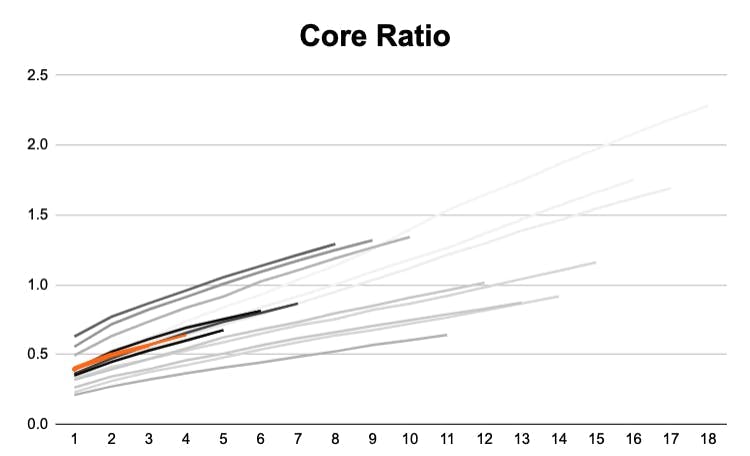
In order to understand how well your marketing is working, compare a given month’s marketing costs (including employee headcount costs) to that of the gross margin accumulated by that group. We call this the Core Ratio. On any given month, one can see what multiple of those marketing costs has been recouped. In the chart below, each line represents a specific customer cohort.
When the ratio is 1, it means your cohort of users has paid back its marketing costs. If it is 2, then you have returned 2X your marketing costs on a gross margin basis.
Illustrative Core Ratio Visualization
Each month the data will update and one can gauge how each cohort is doing.
With the Core Ratio a business can see:
- The % of a cohort’s marketing dollars that have been paid back
- The multiple on marketing dollars that your new customers are driving
- Which cohorts are performing the best over time
By doing this, a business will have a better sense of future cash-flows as well as future sales and marketing performance.
Estimating LTV
The best way to go about estimating a cohort’s future LTV is by creating what we call synthetic cohorts. We will cover synthetic cohort creation in our upcoming metrics webinar. More on this below.
Headline's Metrics Webinar
We are hosting a Headline metrics webinar at 9 am PT on the 14th of May where we will review the following items:
- Historical transaction-based revenue cohort development
- Core Ratio chart creation
- How to build revenue projections based on historical and projected synthetic transaction data
Register to the webinar >> HERE