
As the economic downturn rolls on, startups are under pressure to revert back to business fundamentals. That means trading a growth-at-all-costs mindset for one of sustainability.
While there are a lot of aspects to what makes a business sustainable, a few key metrics are critical to long-term success. Product-market fit is one of the most important, since it proves there’s real customer demand for a company’s product or service. It’s a popular metric among venture capitalists and startup founders alike—but measuring it accurately is key.
The problem with the way many in the industry assess product-market fit is the way they measure customer retention. There are several ways to calculate this metric, which can create confusion and even misinterpretation when conveying business performance. But for founders in particular, it’s more important than ever to calculate average retention to both inform decision-making and demonstrate their business’ sustainability. Here’s how we do this at Headline, which might differ from what you’ve seen before:
Calculating Weighted Average Retention
A company needs to have an aggregate data series across all cohorts to communicate how many customers or how much revenue it retains on average once a new cohort has been acquired. The traditional method of calculating this aggregate is by simply taking the average of all available retention data-points for each lifemonth (months a given customer cohort has been with a business) (see Figure 1).
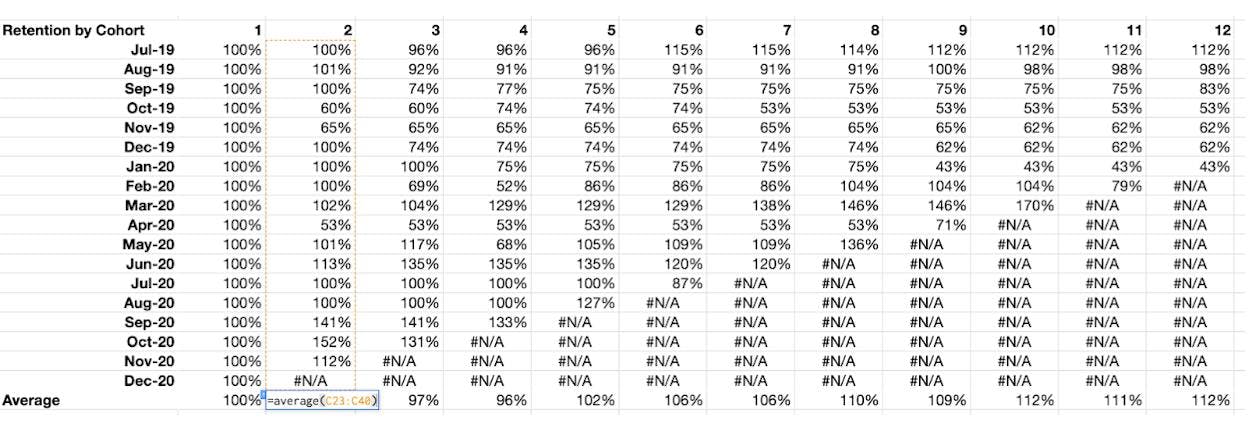
The issue with this method is that, in a sense, it assumes that all cohorts are created equal. In reality, some cohorts will be far greater in size than others. To make a general statement about how many customers a business retains for each 100 it acquires (which really is the purpose of the average retention) would be inaccurate; Larger cohorts might retain a different absolute number of customers compared to a smaller one, but will still be weighed the same in the average percentage calculation. This aggregation methodology, therefore, does not accurately indicate how many customers a business retains for every 100 that it acquires.
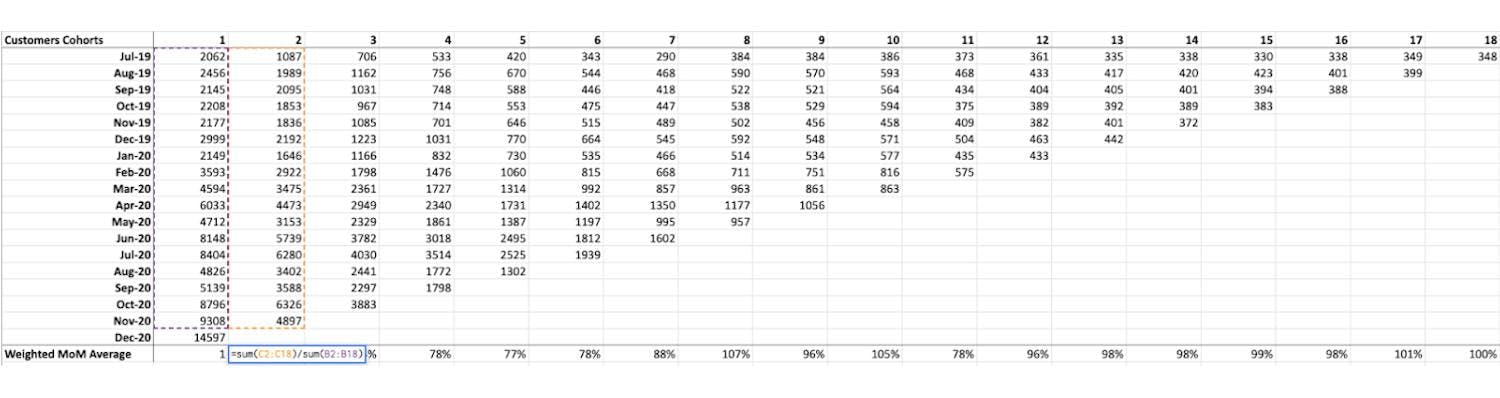
We solve this at Headline by using a weighted average. Beginning at lifemonth two, we take the sum of customers (or revenue) for a certain lifemonth from the cohort stacks (columns 1-18 in Figure 2) and divide it by the previous lifemonth’s sum of customers (or revenue). This gives us the weighted average month-to-month retention, which indicates how many customers or revenue are retained from one specific lifemonth to the next.
It is important to note that we only sum customers/revenue where data exists in both lifemonths; the data entered in the latest month is thus left out. Because this figure simply did not exist in the previous month, this would skew the weighted average calculation. For example, in the chart below, we do not include the December 2020 cohort in the sum amount, as we only have a lifemonth one value for that given cohort, not a lifemonth two value.
We repeat this process for every lifemonth for which a business has data.
To get to the weighted average retention, one then multiplies out this weighted average month-to-month retention of one lifemonth with the overall weighted average retention, which was calculated at the previous lifemonth. This process is repeated iteratively for every lifemonth, with 100% retention as the starting point (see Figure 3).

Ultimately, the weighted average reflects a percentage of the number of customers or amount of revenue retained across every lifemonth, while appropriately weighting the size of each cohort. This weighted average truly communicates the proportion of customers or revenue a business retains once it acquires a new cohort.
Retention Benchmarks by Industry
Businesses always like to benchmark their performance to see how they perform against the industry. After all, we all like to know where we stand. With this in mind, the primary benchmark we at Headline look at is the point in which a company’s retention data-series fully flatlines above a specific percentage level, indicating that retention is maintained at a certain percentage level indefinitely. We call this the retention asymptote (more on that here).
For any sector, the most important part of building product-market fit is that the business actually gets to a retention asymptote. Then, depending on the business, we assess where the asymptote comes in relative to an appropriate benchmark. We acknowledge different best-in-class benchmarks depending on the types of sectors: consumer businesses, SMB SaaS, or enterprise SaaS.
For consumer businesses, we see a 15% customer asymptote and a 20% revenue retention asymptote as best-in-class. For reference, Spotify has a ~45% revenue retention asymptote, which is incredibly high!
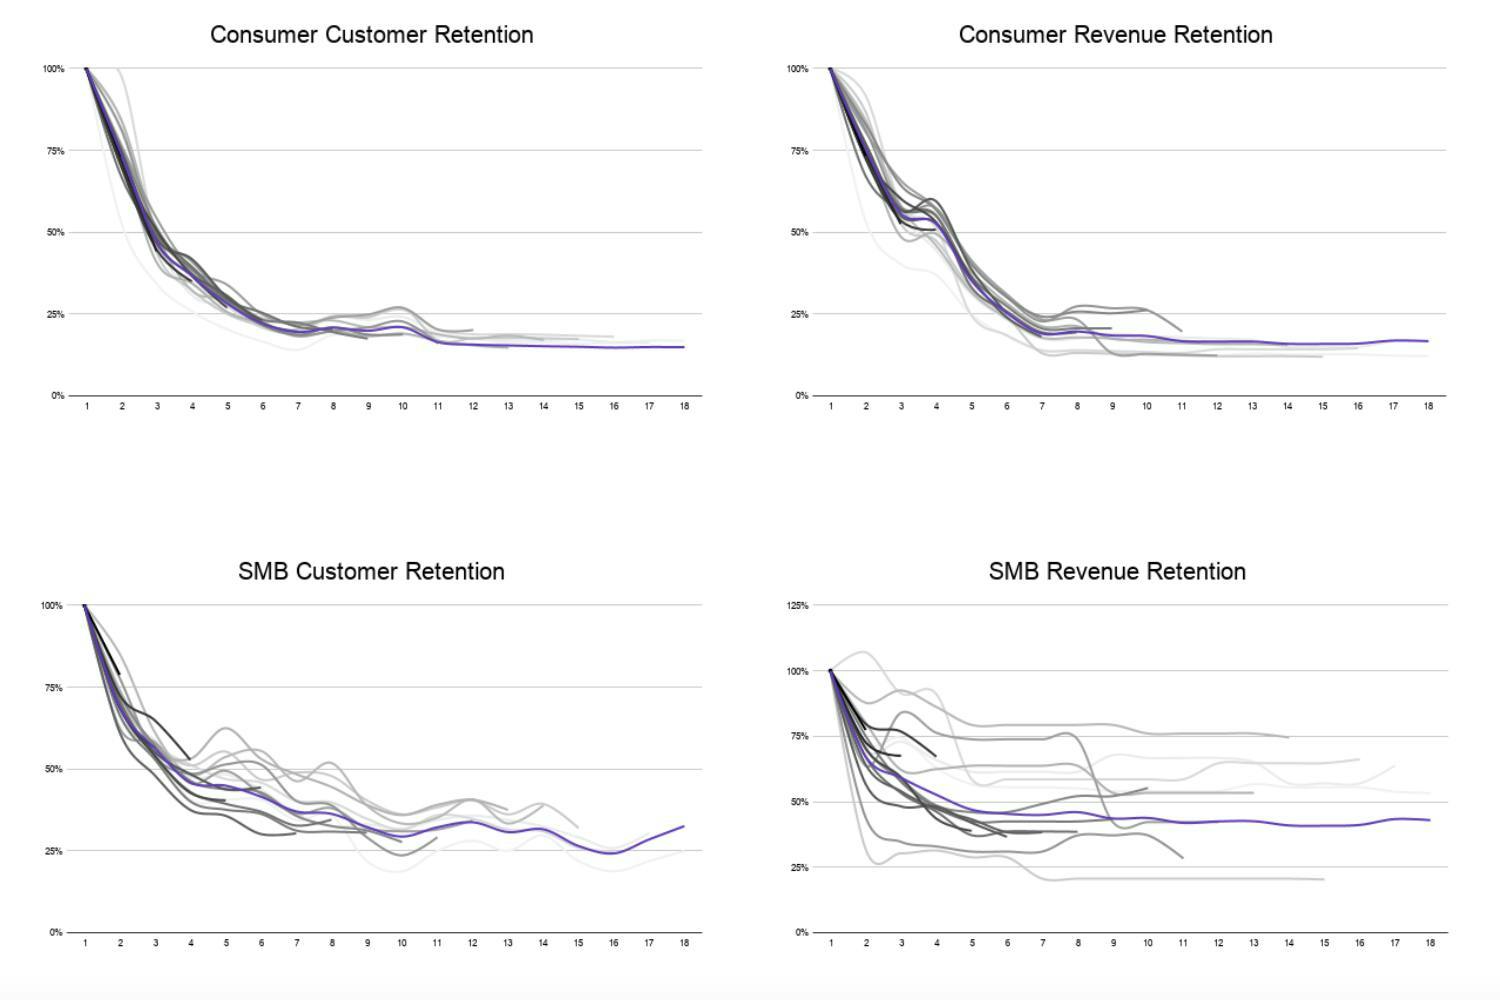
For SMB SaaS businesses, we see asymptotes over 30% for customer and 40% for revenue retention as best-in-class. That being said, the asymptote does not solely determine the success of your business. For example, Mailchimp — a classic SMB SaaS business — has only a ~20% revenue retention asymptote, but the product is widely used and the company highly successful.
For enterprise SaaS businesses, we see anything over a 70% customer asymptote and a 110% revenue retention asymptote as best-in-class.
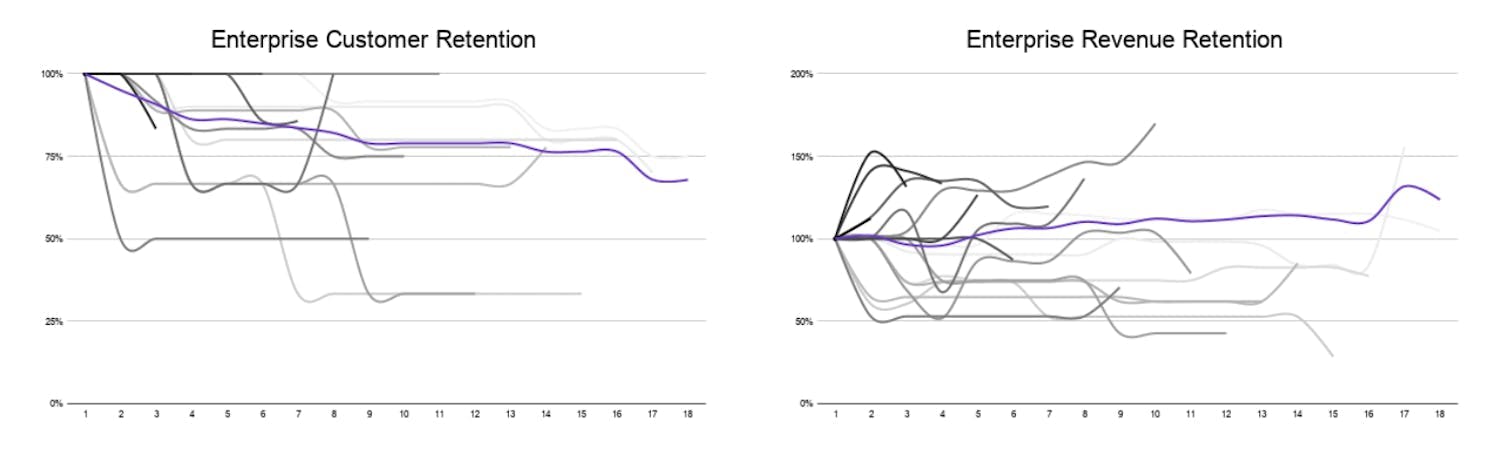
You will find that for all segments we expect a higher revenue retention asymptote compared to the customer asymptote. Again, these benchmarks are by no means the sole determinants of business success, but they are simply values we recognize from the best-in-class companies we have seen operating in each sector.
What founders can glean from their retention benchmark, especially now
MoM retention and the retention asymptote are great data points for companies to investigate their businesses further and make decisions about growth rather than the be-all end-all of company viability or even success.
With sustainability at the forefront of business leaders’ minds, for example, companies might be looking to save costs and consequently cut must-have versus nice-to-have products. Nice-to-have products that used to have firm asymptotes consequently might start seeing churn in some of their established cohorts, which will lower or destroy their retention asymptote. A strong retention asymptote can signify a businesses’ product status as a must-have, and provide an indication of sustainability.
However, that’s not always the case. Some businesses can have higher or lower retention asymptotes simply based on their marketing channels. The lower the barrier to adoption is, and the wider the marketing funnel, the lower the retention asymptote will most likely be because you have more customers that start adopting the product that probably won’t be using it in the long term. A freemium product will have more new customers every month, but will also have more of them churning out from it after month one compared to the same product with the paywall upfront, which would have less new customers, but less churn after month one as well.
The bottom line: companies can use this benchmark as an indication to further investigate and account for strengths or weaknesses within their business. It’s just one metric in the broader picture of things like product-market fit and capital efficiency that will truly prove business value and ability to weather even the toughest economic times.