Technology
2. What SaaS Financial Ratios Should You Go Public With?… And Why No One Size Fits All
The previous post (link) in this analysis benchmarked median and top quartile financial ratios, and touted the importance of considering Gross Profit in these calculations. This analysis tracks these ratios as companies scale, while also outlining why it is crucial for entrepreneurs and executives to consider these ratios relative to reach other, and not in a vacuum:
- What these ratios could look like for companies targeting an IPO
- How these ratios progress with scale
- Why there is no one-size-fits-all ratio benchmark given different markets, product and go-to market motions
Feel free to drop me a note if you have any questions or thoughts.
Background — SaaS Companies at IPO
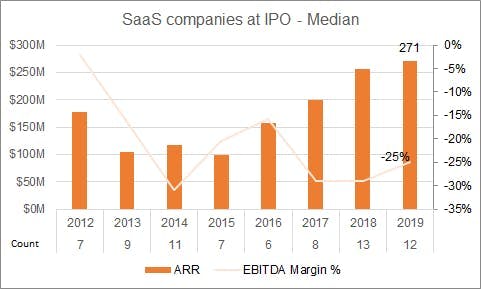
It is not new knowledge that IPOs are waiting longer to go public — of the 12 SaaS companies that went public in 2019, the median ARR was $271M — much larger than the median ARR of $100M in 2015.
Interestingly, while companies are meaningfully unprofitable — the median EBITDA margin of 2019 IPOs being [25%] — this has been relatively consistent with the last 5–6 years; 2014’s median EBITDA margin was [30%].
SaaS Companies at IPO — Median ARR and EBITDA Margin %
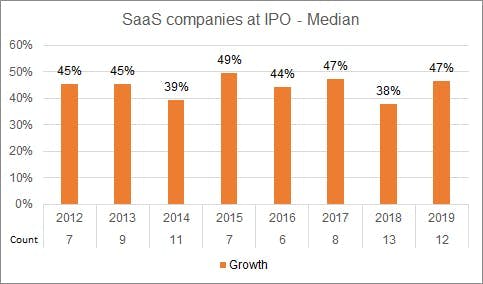
The median ARR growth rate at IPO has also been consistent over time — typically between 40–50% YoY Growth.
SaaS Companies at IPO — Median ARR Growth %
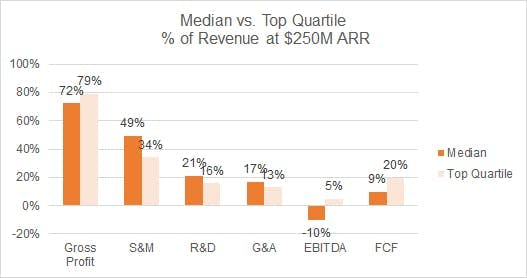
What Does a ‘Great’ Company’s Ratios Look Like at $250M ARR?
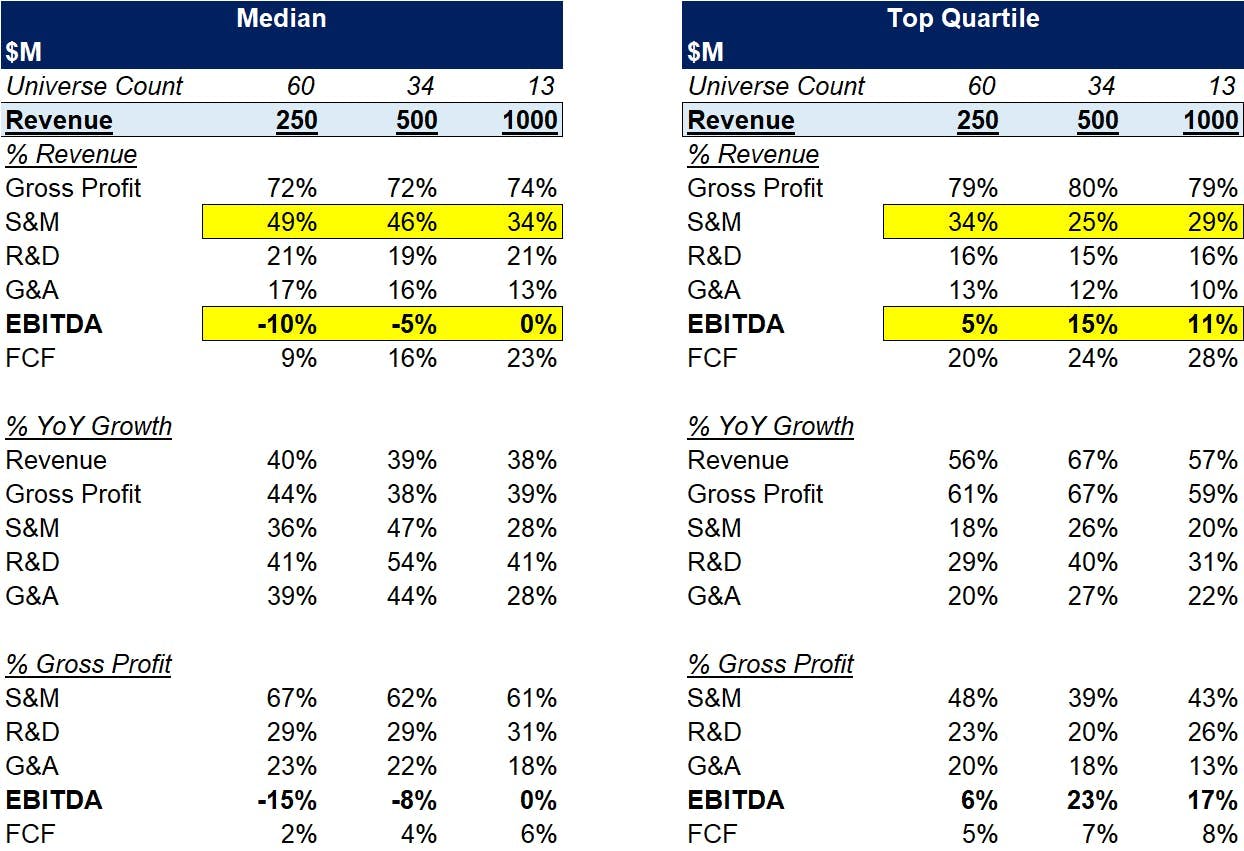
This analysis looks at when 90+ SaaS companies (link here) surpasses certain ARR threshold and their respective ratios at that precise point in time, while noting the difference in margin profiles (link here).
A company looking to target the median / top-quartile ratios at $250M ARR will have the below ratios, according to the quarter in which all public SaaS companies reached $250M ARR. ‘Top quartile’ in this analysis refers to the top quartile of that specific ratio, i.e. the top quartile of S&M efficiency.
Relative to Revenue:
- Gross Margin — 72 / 79%
- Sales and Marketing — 49 / 34%
- Research and Development — 21 / 16%
- General and Admin — 17 / 13%
- EBITDA — [10] / 5%
- Free Cash Flow — 9 / 20% (defined as Operating Cashflow net of Capital Expenditures)
Financial Ratios of SaaS Companies at $250M ARR — Median vs. Top Quartile. n = 60
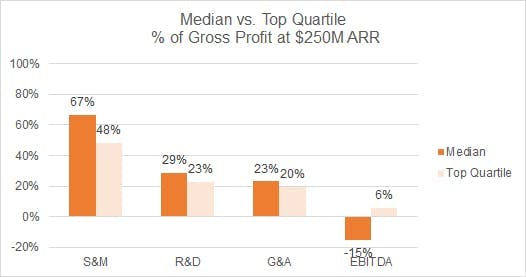
And relative to Gross Profit:
Financial Ratios of SaaS Companies at $250M ARR — Median vs. Top Quartile. n = 60
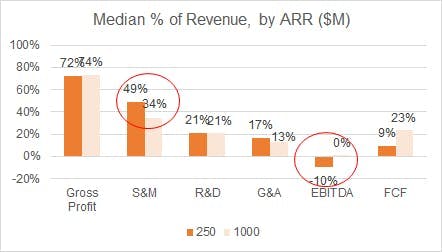
How Do Ratios Improve With Scale?
Once a company has gone public, there may be greater focus on showing profitability in the medium term. While again recognising survivor bias, the below chart shows where profitability improvements generally arise from:
- Median S&M expenses as a % of Revenue falls from 49% at $250M ARR, to 34% by the time they reach $1Bn in ARR
- This occurs while median R&D remains flat (at 21% of revenue) and G&A also sees meaningful operating leverage (17% down to 13%)
- Median EBITDA margin improves from [10%] to 0%, while FCF margin improves from 9% to 23%
This indicates that a meaningful proportion of operating leverage at scale comes from increased S&M efficacy, benefiting from stronger brand recognition, execution, channel partnerships etc.
Financial Ratios of SaaS Companies at $250M ARR — Median vs. Top Quartile. n = 60
See Appendix below for further detail.
No One Size Fits All… Using Magic Number and Rule of 40
While having these numbers is helpful, it is important that entrepreneurs, executives and investors not look at each of these various ratios — growth, margin and cost bases — independent of each other.
While it is easy to draw simple conclusions that a company’s cost base is overly inefficient (i.e. Twilio over-indexing in R&D) or underinvesting (Zoom’s relatively low R&D), it is crucial to understand the subject company’s underlying market, growth rate, customer type, product and requisite go-to market motion when considering these ratios.
Instead, various metrics, such as Magic Number and Rule of 40, are used prolifically to address the shortcomings of these financial ratios.
Next: 3. Magic Number and Rule of 40… Helpful, For Now
Appendix: Greater Detail on Ratios
The below are summary details at each stage of ARR:
Other topics in the series:
Introduction — SaaS ‘Burn Productivity’… Better Than Magic Number and Rule of 40?
Background:
- SaaS Financial Benchmarking… One Size Doesn’t Fit All, and Focusing on Gross Profit — benchmarking growth, margins and opex items
- What Financial Ratios Should You Go Public With?… And What Should They Look Like Longer Term? — P&L ratios at various stages of their growth curve, from pre-IPO through to large scale, and why there is no ‘one size fits all’
- Magic Number and Rule of 40… Helpful, For Now — Showing that these metrics haven’t always been correlated to higher valuations
Burn Productivity:
4. ‘Burn Productivity’… A Consistently Better Signaler of SaaS Valuation — Defining Burn Productivity and its stronger correlation with valuation owing to its capturing of product-led growth
5. How Does Burn Productivity Drive Profitability and SaaS Valuation? — A Practical Example — Valuation and its stronger relationship to Burn Productivity via a first-principles look at the drivers of valuation