Technology
4. ‘Burn Productivity’… A Consistently Better Signaler of SaaS Valuation
The prior analysis showed that while valuation is nicely correlated to Magic Number and Rule of 40 as of 1Q 2020, the correlation hasn’t necessarily held up over time and as companies scale.
This analysis identifies a metric that has shown remarkably stronger valuation correlation over time, and has in fact gotten stronger — Burn Productivity.
This post outlines about Burn Productivity:
- Correlations with valuation
- Why Burn Productivity is better than Magic Number and Rule of 40
- How to calculate it
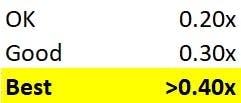
- >0.4x is ‘best in class’ for this metric
- Some examples of leading companies
- Why it better factors R&D/product-led growth
Feel free to drop me a note if you have any questions or thoughts.
And the greatest number of all time is… (PHOTO CREDIT: BOB FRID — USA TODAY SPORTS)
Burn Productivity Has Better Valuation Correlations Now, and Over Time
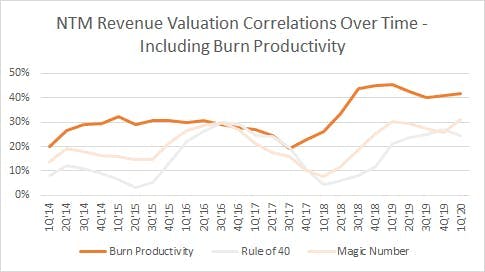
Magic Number and Rule of 40 have been in the SaaS vernacular for a long time, and has been adopted by the wide majority of SaaS entrepreneurs and executives as being the gold standard. However, when looking at valuation correlations over time — it’s clear that Burn Productivity has nearly always outperformed these two other metrics. Valuation (as measured by NTM Revenue multiple) has been ~40–45% (R Square) correlated to Burn Productivity for the last ~2 years, compared to 20–30% for Rule of 40 and Magic Number.
R Square — Smoothed Over Trailing 4 Quarters
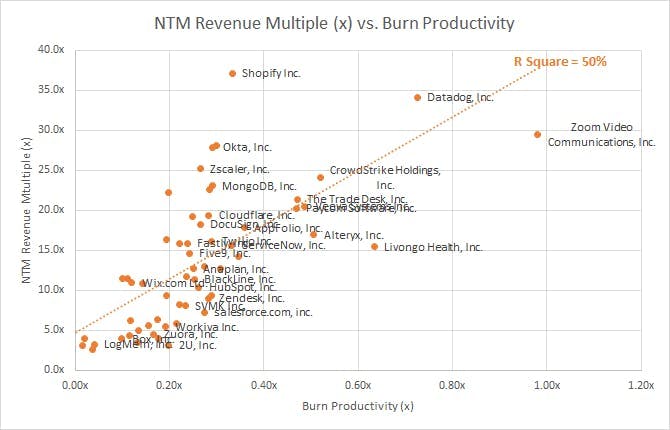
In fact, looking at today’s correlation, valuation displays a 50% correlation with Burn Productivity:
Data As Of 6/8/20, Using Consensus Estimates (CIQ)
Why Is This Metric Better?
Burn Productivity captures multiple items that Magic Number and Rule of 40 ignore:
- Outlier Growth — A low growth, high margin business, compared to a high growth, low margin business, both with an equivalent Rule of 40 will drive meaningfully different Enterprise Value longer term, but won’t be captured in this Rule of 40. Magic Number partially captures this, but not fully
- Gross Margin — high gross margin businesses will receive more recognition where Magic Number penalises them relative to low margin businesses
- R&D Spend / Product-Led Growth — see paragraphs below; Magic Number does not capture R&D efficacy
How To Calculate Burn Productivity
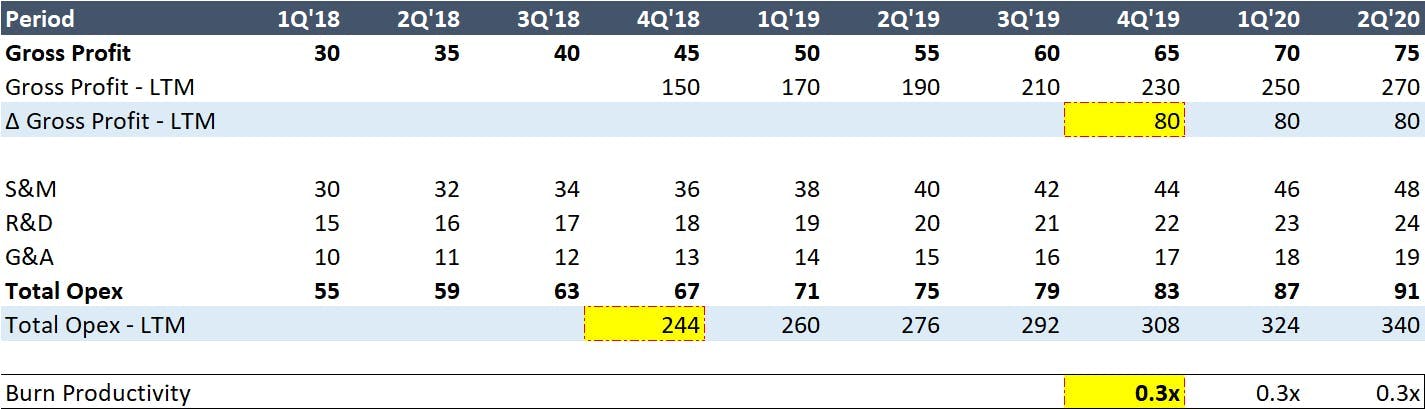
Conceptually, the idea of Burn Productivity is simply to assess the ROI on total opex spend in a prior period — i.e. the net new Gross Profit added in a defined period, relative to the gross opex spent in the prior period.
To calculate Burn Productivity, I have used a LTM (last 12 months) calculation rather than a quarterly calculation, realising that many SaaS companies particularly at the earlier stage have relatively lumpy sales cycles where a handful of contracts can significantly change the course of a quarter.
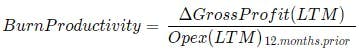
Burn Productivity is calculated as:
- The change in LTM Gross Profit at a certain time compared to the LTM Gross Profit 12 months prior,
- Divided by LTM Opex 12 months prior, where Opex is the sum of S&M, R&D and G&A (but excluding COGS)
An example is laid out below:
How To Calculate Burn Productivity
What Is ‘Best In Class’ Burn Productivity
As described in the next paragraph, a company with >0.4x can be considered ‘great’ from a Burn Productivity perspective.
Guideline to Burn Productivity
How does this compare to your company?
Which Companies Have The Best Burn Productivity?
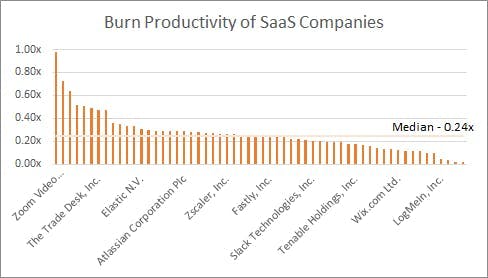
The median Burn Productivity for SaaS companies post 1Q 2020 earnings is 0.24x — with nearly half of the companies banded between 0.2x and 0.3x:
Burn Productivity ranked (n=60)
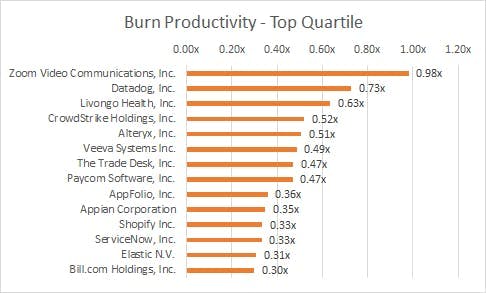
Above 0.3x is when things start to get very interesting — the top quartile of companies ranked by Burn Productivity begin to grow beyond 0.3x with meaningful intensity — Zoom leading the pack with 0.98x Burn Productivity (Sir Donald Bradman would be proud).
Of this quartile, common threads on these companies are:
- Freemium with immediate time to value — Zoom, Datadog, CrowdStrike, Shopify
- Low-cost R&D headquarters — Zoom (China), Datadog (France), Alteryx (CO), Paycom (OK), AppFolio (SoCal), Shopify (Canada), Elastic (Netherlands)
- Vertical-specific — Livongo (Healthcare), Veeva (Pharma), The Trade Desk (advertising), AppFolio (Real Estate), Shopify (E-commerce)
In future posts of this series, we go into greater depth on what companies can do to drive stronger Burn Productivity, and explain some of the above factors. My colleague and Partner at e.ventures, Brendan Wales, has written on the topic of Vertical Software — check it out.
Top Quartile rankings of Burn Productivity
How Burn Productivity Captures Product-Led Growth
Simply put, well-invested R&D can also significantly drive down CAC, so should be factored into CAC / efficiency calculations. Total Opex is used in Burn Productivity’s calculation because it factors the role of R&D in driving a business’ product adoption, its customer base and ultimately its go-to market strategy.
Increasingly, SaaS businesses have moved increasingly towards a product-led, bottoms-up strategy whereby customers’ end-users adopt incredible SaaS products after discovering them organically (needs-based, community, network effects etc), drive its proliferation internally before driving broader enterprise-wide adoption.
Some good examples of products that have driven product-led growth are Zoom (non-customers can easily see the benefit of Zoom in a low-friction way when invited by paying customers) and Datadog (seamless self-serve and time to value). Similarly, vertical-specific solutions that are clear product leaders benefit from easier word-of-mouth customer acquisition.
This compares to the traditional top-down approach of selling large enterprise contracts to key decision makers (e.g. CIOs) that are reliant on dominant enterprise sales teams rather than network effects, with R&D teams investing heavily in a suite of products that may be strong in functionality, but are not easily ‘shareable’ nor conducive to network effects, amongst other factors.
Traditional measures such as Magic Number and Rule of 40 do not capture companies that provide outlier ROI via the growth and efficiencies gained via strong product-led R&D.
Why Burn Productivity Drives Valuation
Next: 5. How Does Burn Productivity Drive SaaS Valuation?… A Practical Example
Other topics in the series:
Introduction — SaaS ‘Burn Productivity’… Better Than Magic Number and Rule of 40?
Background:
- SaaS Financial Benchmarking… One Size Doesn’t Fit All, and Focusing on Gross Profit — benchmarking growth, margins and opex items
- What Financial Ratios Should You Go Public With?… And What Should They Look Like Longer Term? — P&L ratios at various stages of their growth curve, from pre-IPO through to large scale, and why there is no ‘one size fits all’
- Magic Number and Rule of 40… Helpful, For Now — Showing that these metrics haven’t always been correlated to higher valuations
Burn Productivity:
4. ‘Burn Productivity’… A Consistently Better Signaler of SaaS Valuation — Defining Burn Productivity and its stronger correlation with valuation owing to its capturing of product-led growth
5. How Does Burn Productivity Drive Profitability and SaaS Valuation?… — A Practical Example — Valuation and its stronger relationship to Burn Productivity via a first-principles look at the drivers of valuation