
For any startup, tracking business performance is incredibly important. But the only way to paint an accurate picture of how a business is performing is to use the appropriate metrics within the appropriate contexts. Without the right methodology, numbers begin to lose their meaning. And often, the same set of figures can come about very differently, even posing contradictory outcomes—resulting in more confusion.
Calculating average customer retention, for example, can be a tricky part of assessing product-market fit. With a weighted average, however, variabilities can be accounted for among customer cohorts—ensuring that the data isn’t skewed and leading to a more accurate understanding of average customer retention month-to-month.
Net retention poses a similar challenge when it comes to interpreting and presenting data. Many companies calculate net retention to measure the proportion of customers or revenue it retained from one period to the next. At Headline, however, we see very little value in tracking this metric. Of course, we should always keep a close eye on revenue and customer behavior—but there’s a way for founders to observe this data without conflating the actual figures.
Let’s take a look at why calculating net retention may not be the most effective way to measure business performance:
Understanding net retention
Net retention is the net figure of a business’s retained revenue or customers. Think of a business as a bucket collecting water—but the bucket also has a leak. Net retention measures the rate at which the bucket leaks, considering how much water it has collected.
There are a couple of key underlying forces that impact net retention: “churn” and “expansion” (see Figure 1 and 2). “Churn” occurs when a customer stops transacting with a business from one month to the next, causing both a reduction in the business’s active customer base and revenue. “Downsell” falls under the broader umbrella of churn, but only happens when an active customer ends up spending less in the following month—in other words, if there was no observed reduction in customer count but there was still a reduction in revenue.
“Expansion” describes an increase in a business’s revenue or customer base, but it excludes newly acquired revenue or customers, focusing solely on returning revenue or customers. There are two different types of expansion: “upsell” and “resurrection.” Upsell implies that a customer spent more in one month compared to the month prior—and while it doesn’t add to the customer base, it does increase revenue from one month to the next. Conversely, resurrection means that a customer that had originally churned becomes active again. It implies an increase in both customer count and revenue base.
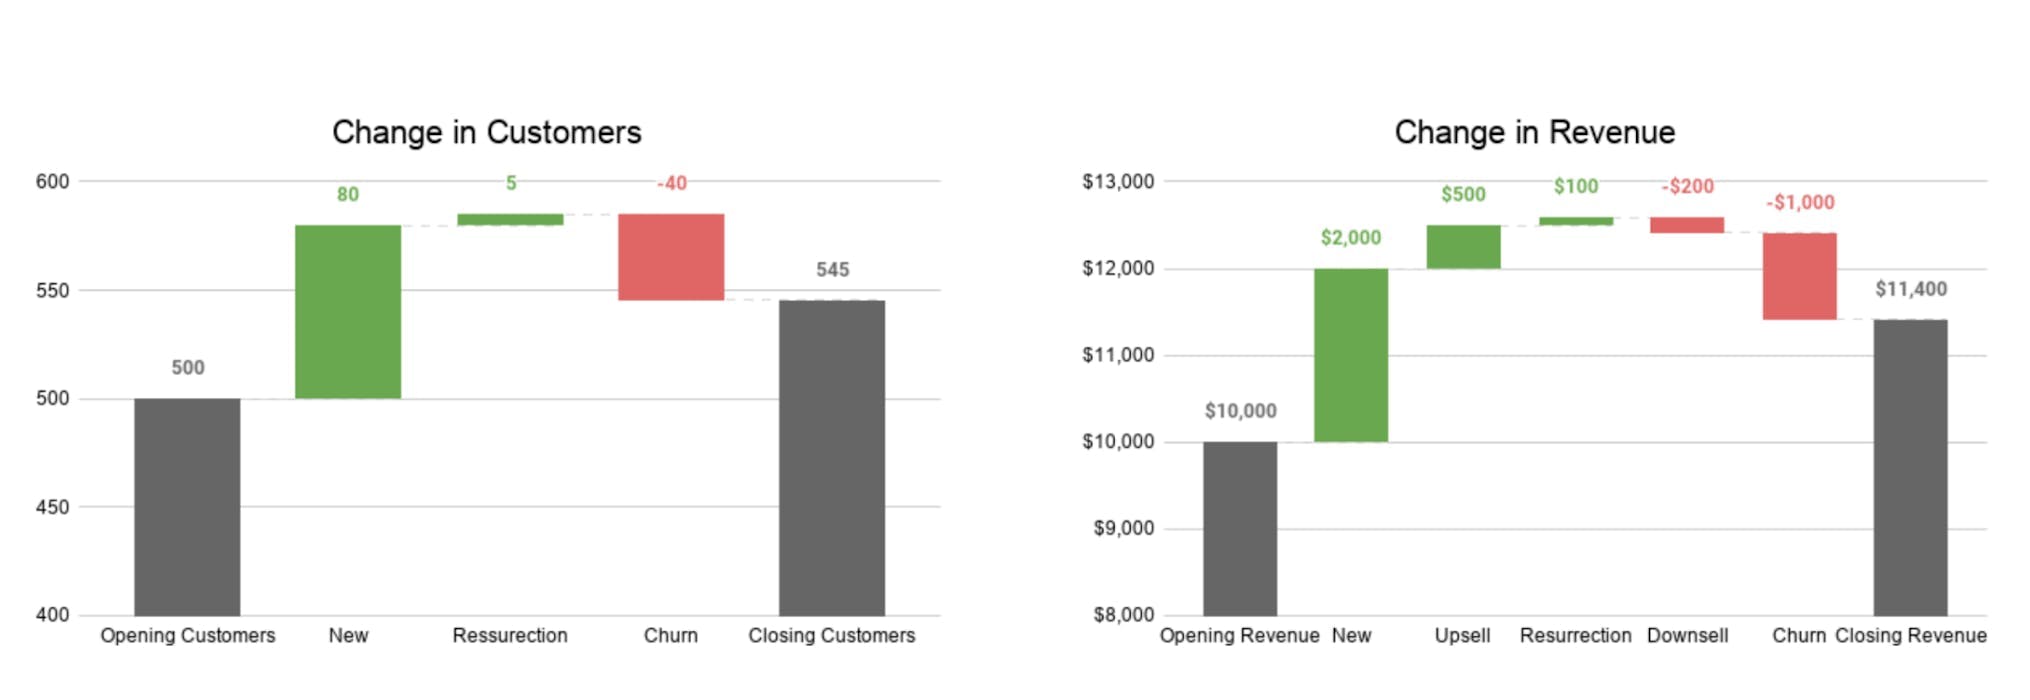
One important distinction to remember: Net retention aggregates all possible movements of revenue or customers. This is different from looking at gross effects—like gross churn, gross expansion, gross resurrection—in isolation. Gross values focus on targeted, individual effects on retention that either complement or counteract one another, while net values embody the final effect of all of these individual forces acting together. As a result, positive movements are deemed as net expansion, while negative movements are deemed as net churn.
Why net retention shouldn’t define your business
In order to implement an effective business strategy, companies need reliable, consistent insight into their revenue and customer base. But it’s pointless to use net retention, simply because the final figure doesn’t solely account for revenue or customer behavior. A jump in net retention can be driven just as much by a business’s growth rate, for example, leading to confusion around what the number is actually measuring in the first place.
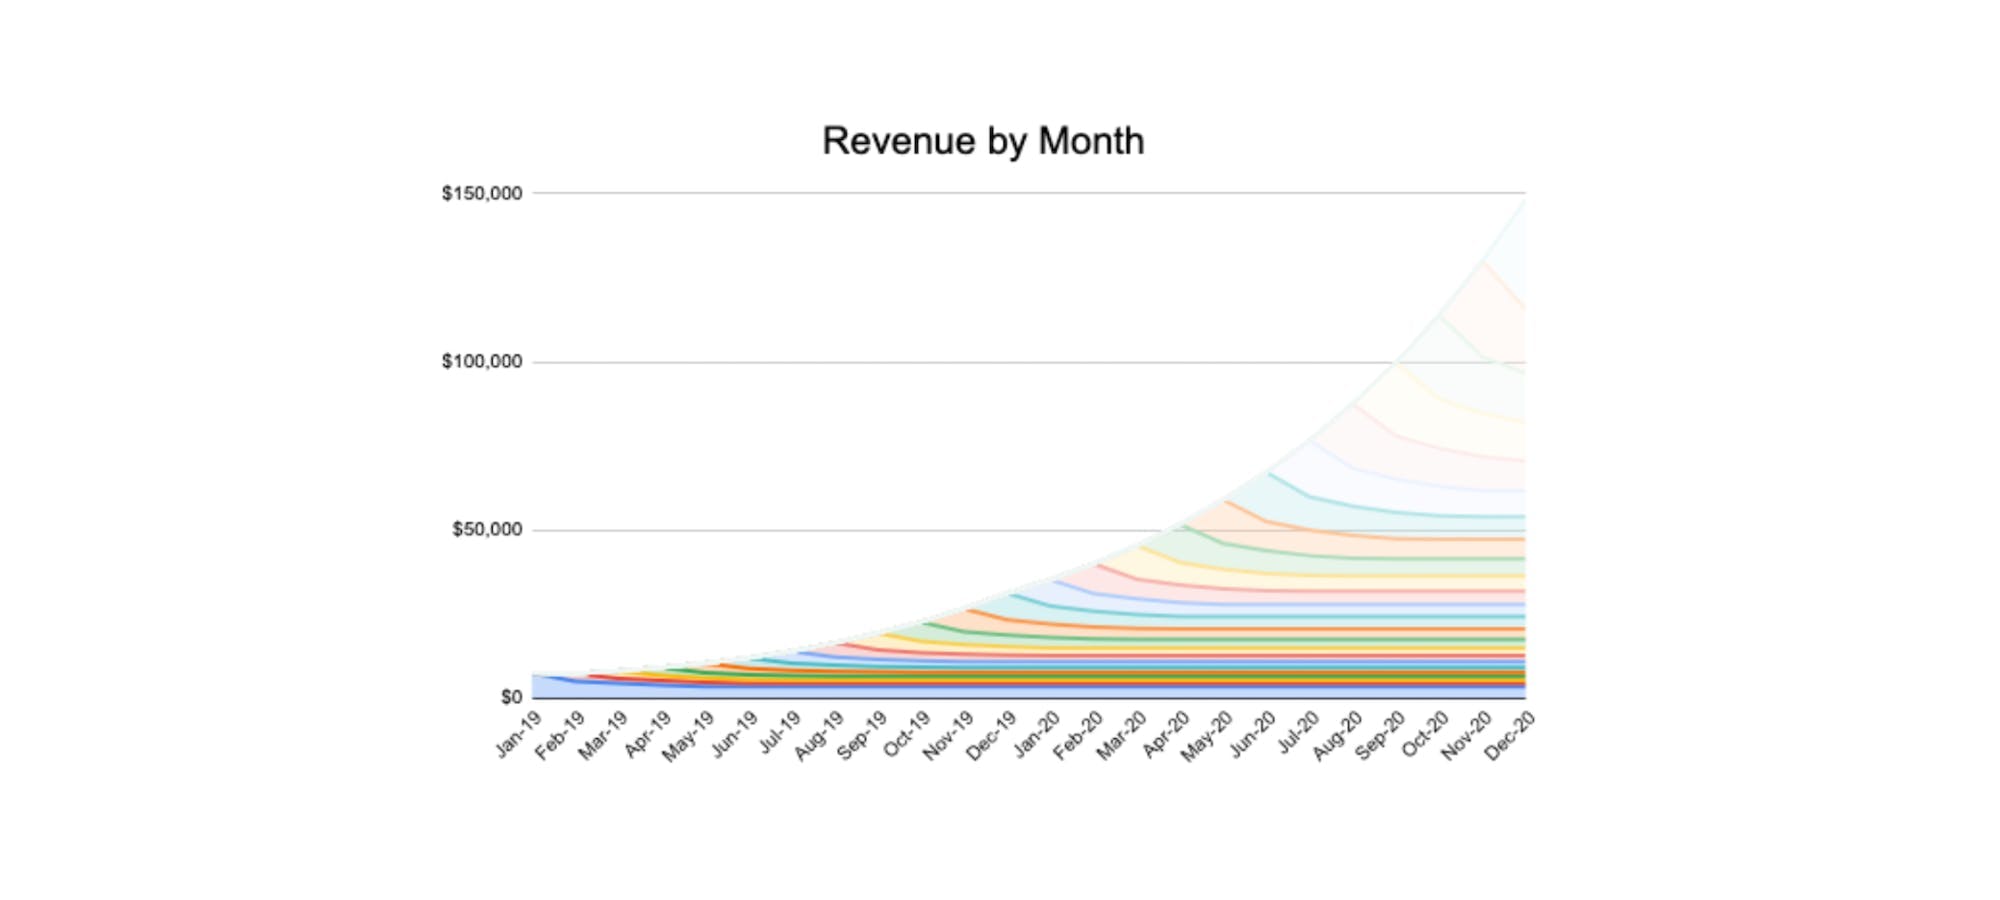
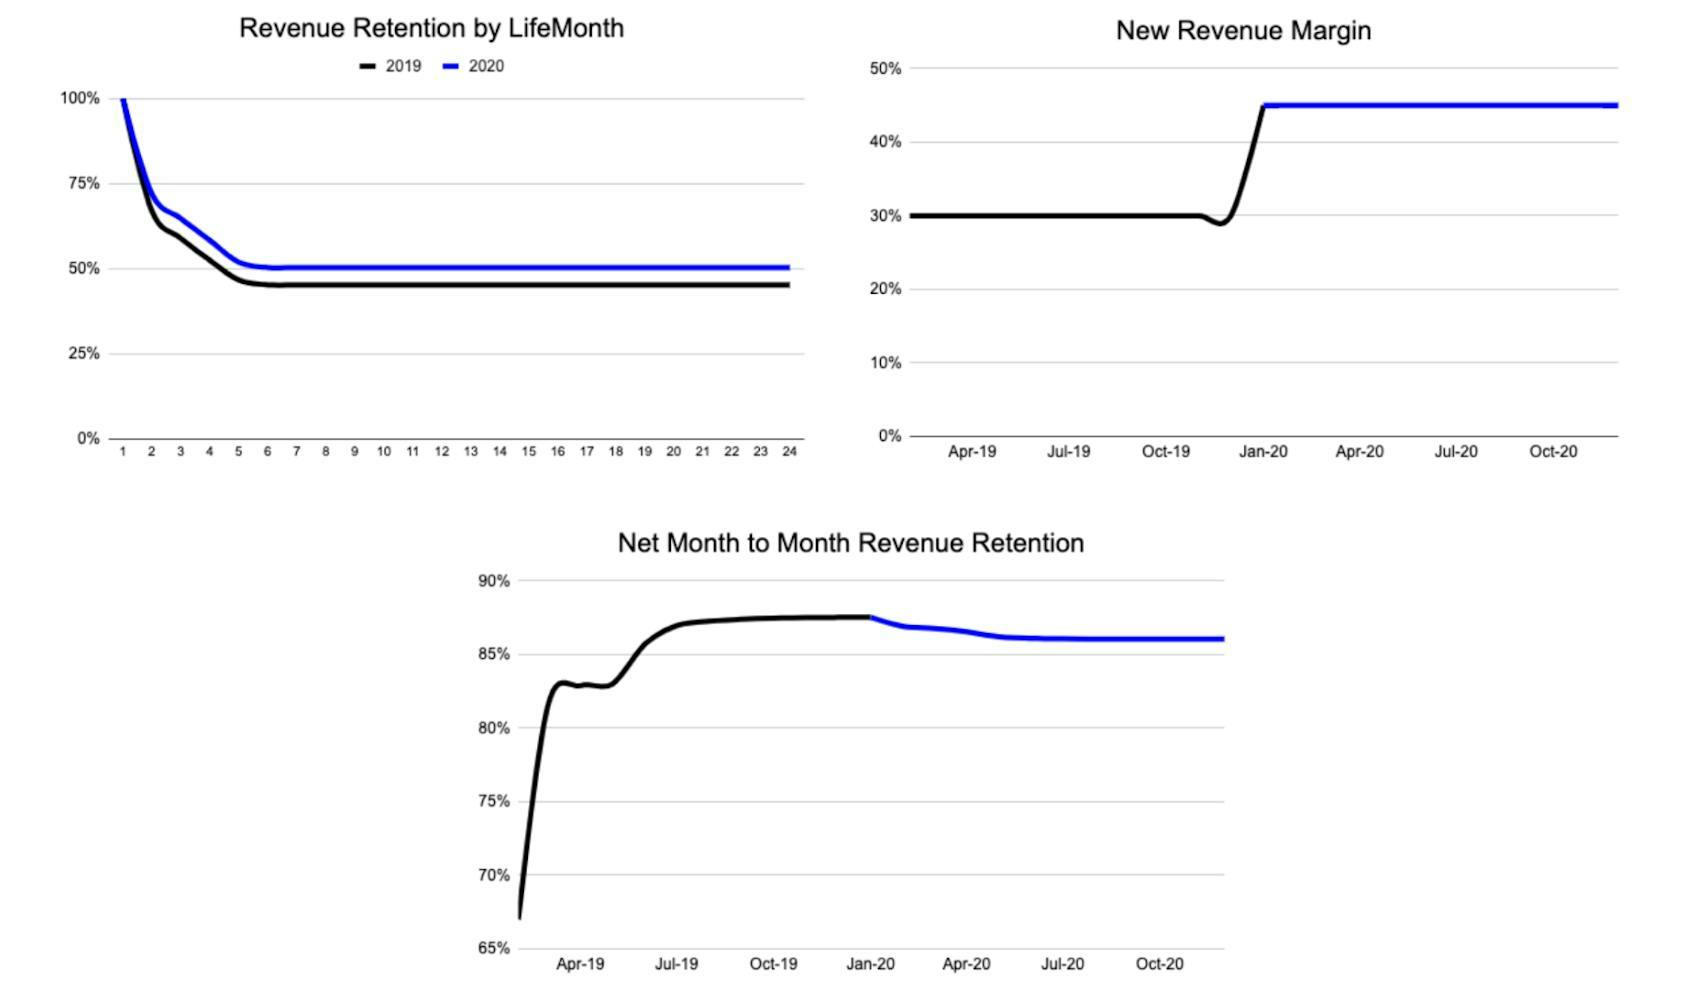
In Figure 3, the business grew from $5K monthly revenue to $150K monthly revenue over the course of two years, at a compounding rate of 30%.
With the available data, we were able to calculate the net revenue retention for the business (see Figure 4). After starting at 65%, we see that it improves for a while before hitting a plateau at around 87%.
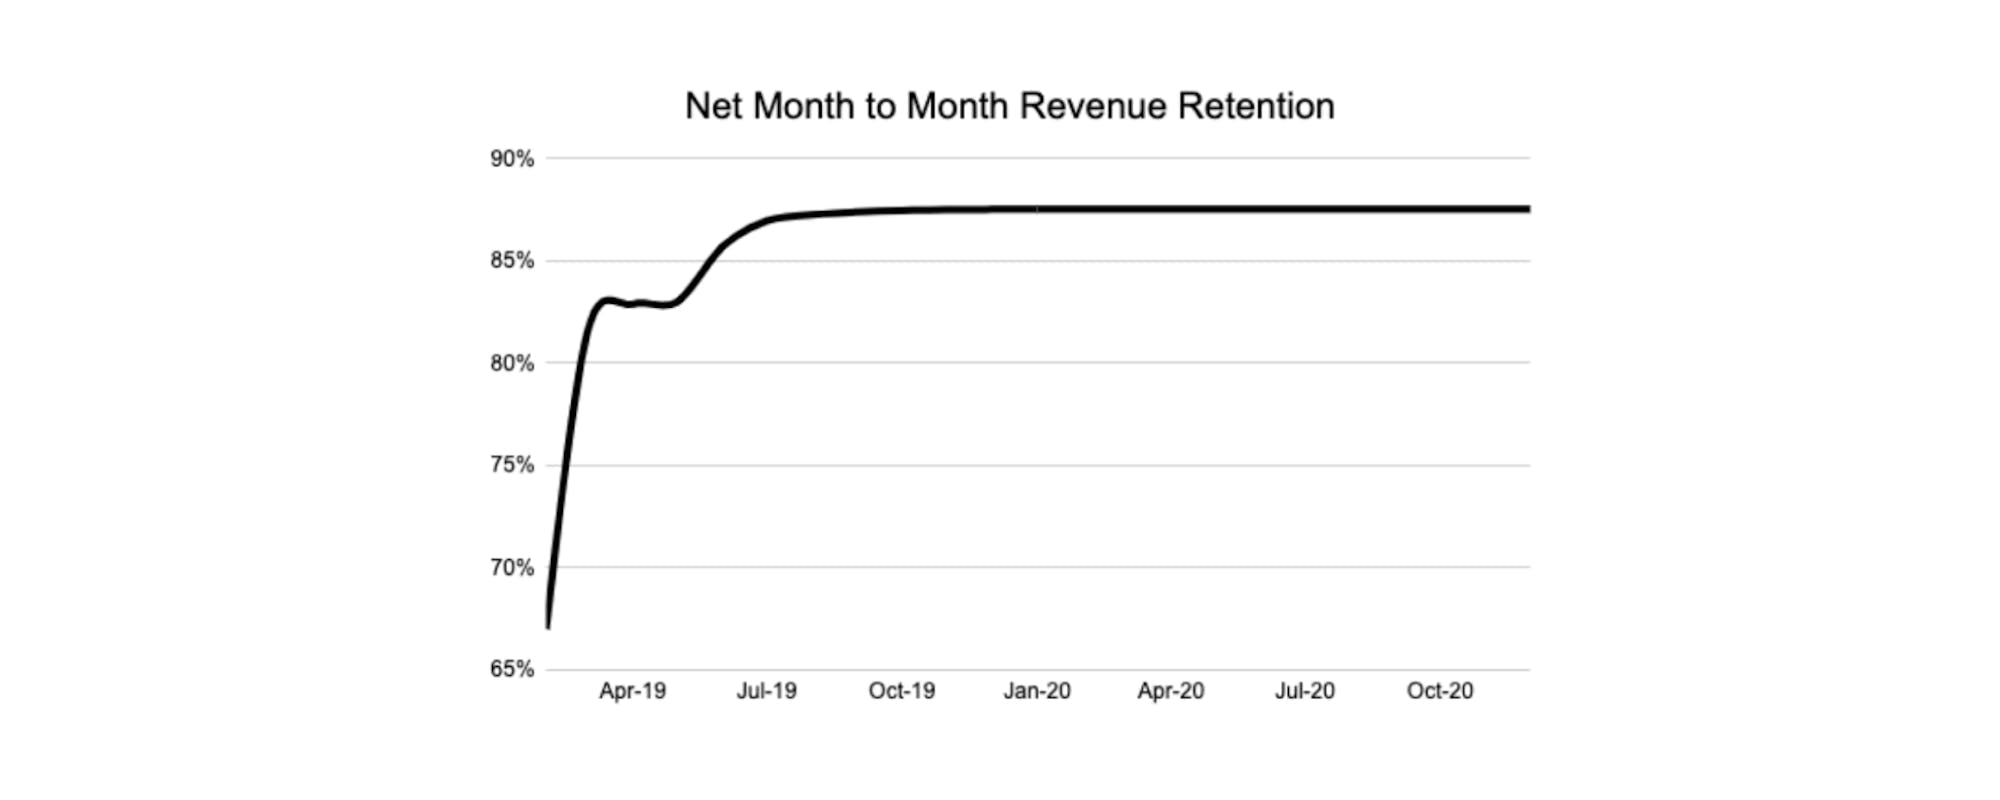
For most consumer businesses, most churn occurs within the first 6 lifemonths; and for small-to-midsize businesses, that figure is just around 12 lifemonths (lifemonth refers to the amount of time that a given customer cohort has been with a business). In other words, the marginal rate of churn for any cohort decreases as a cohort grows older—until it reaches an asymptote as seen in Figure 4 above, when the cohort’s retention rate plateaus and experiences no more churn at all.
As the proportion of cohorts that find themselves in the later lifemonths increases compared to the total revenue base, the amount of net churn in relation to the total revenue base decreases; subsequently, this raises the net retention rate. To put it simply, net retention will only remain stable if there’s a proportionate amount of revenue that experiences churn.
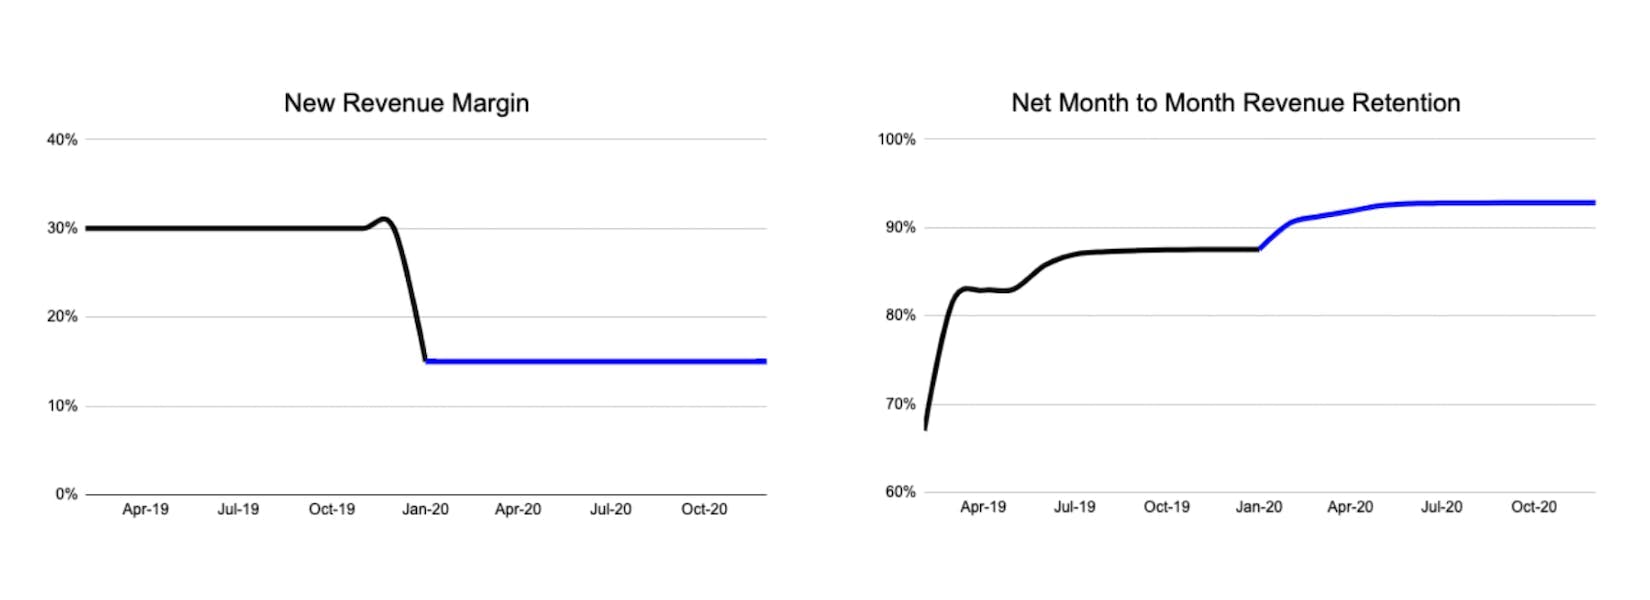
Now, here’s where things can get funky. If the business experiences a lower growth rate—say, if its revenue margin falls from 30% to 15%—it acquires fewer new customers, meaning that its customer base “ages up” as it now mostly consists of cohorts in their later, low-churn lifemonths. This scenario would result in an increase in net retention because a lower churn rate contributes to a higher net retention rate for the business, even though its retention by cohort remains stable (see Figure 5 and 6).
Vice versa, if a business’s growth rate increases, net retention decreases due to having more customers in their earlier, high-churn lifemonths. There could even be a scenario wherein overall retention by cohort increases by each lifemonth and the business’s growth rate continues to accelerate, but its net retention still decreases (see Figures 7, 8, 9 below). In this case, the accelerated growth rate—and by implication, the higher proportion of high-churn customers—offsets the effect of an increased net retention rate.
Put simply, while net retention may provide some limited insight into revenue retention and customer behavior, its inverse relationship with a business’s growth rate often conflates the data, resulting in more confusion and misinterpretation.
The solution? Retention sidecuts
At Headline, we measure retention by cohort and use a retention sidecut. A retention sidecut is essentially a static plot comparing the retention rate of separate customer cohorts in a given lifemonth. It’s called a “sidecut” because we take a slice of data from each cohort in a common lifemonth, allowing us to make comparisons of retention rates between different cohorts at a similar point in their lifecycles (see Figure 10). It eliminates lifecycle variability in our calculation, ensuring that changes in growth rate no longer impact the net figure.
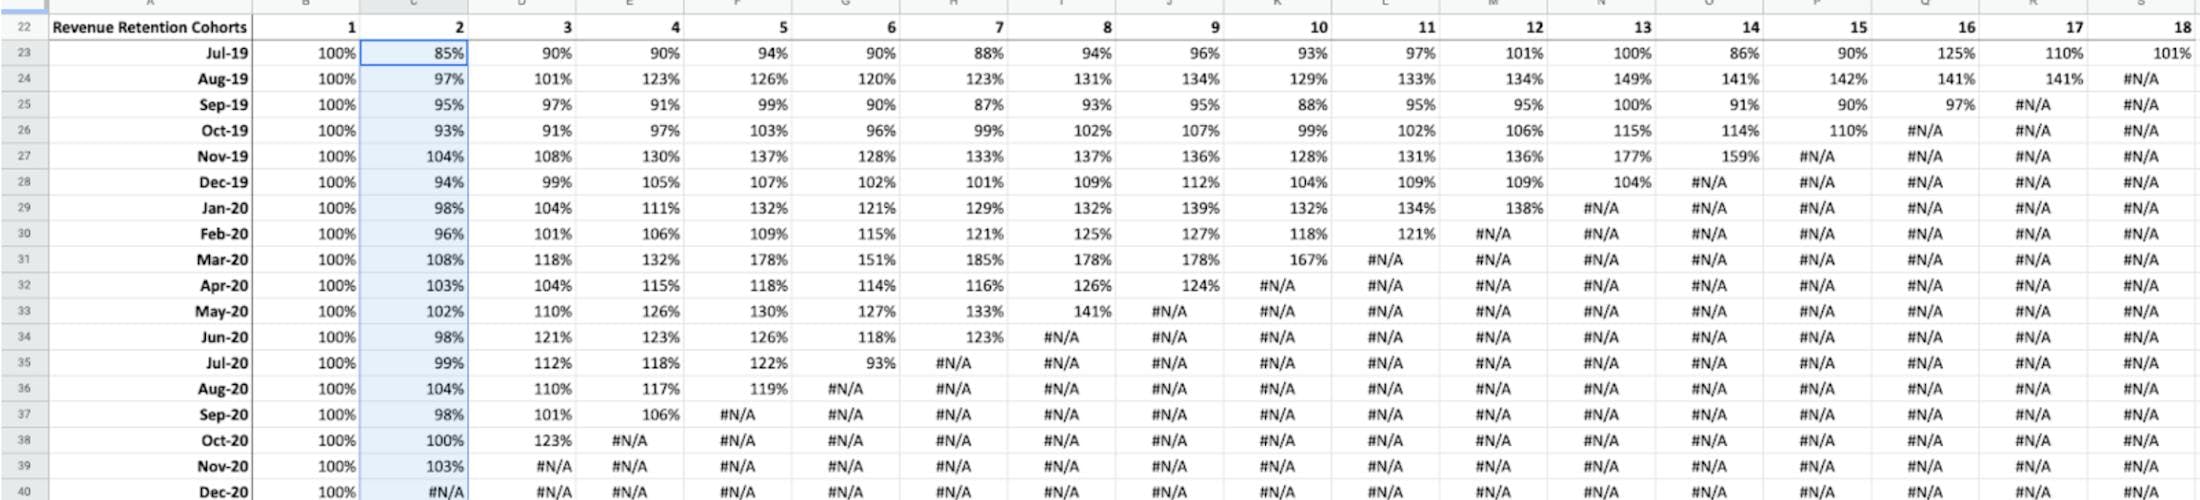
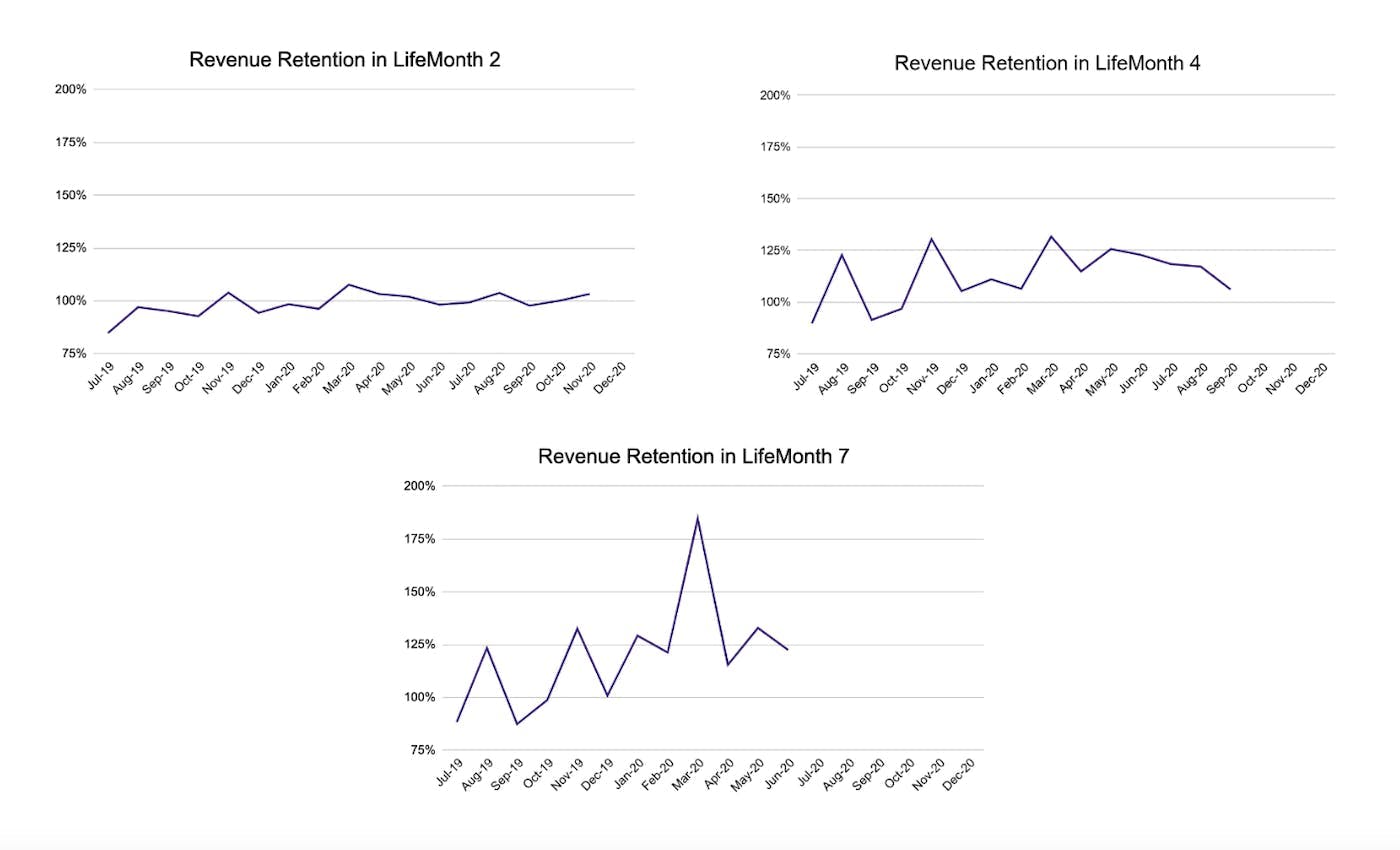
For example, Figure 11 depicts revenue retention for all cohorts in lifemonth 2. The data series trends upwards, indicating that more recent cohorts are retaining more revenue at this point in their lifecycles. In lifemonth 4, however, we see that the trend begins to drop slightly (see Figure 12). Finally, in lifemonth 7, we see that revenue retention increases for the more recent cohorts —another positive indication of business performance, as we are now examining a point in the lifecycle that is closer to the retention asymptote. If all continues to go well for the business, the graph will show that more recent cohorts are reaching asymptotes at a higher point than older cohorts.
For all startups looking to obtain a better understanding of their customer base or revenue, remember that retention by cohort analysis helps eliminate the ambiguities that come with the traditional method of calculating net retention. By differentiating cohorts and measuring their retention rates separately, then utilizing a retention sidecut to visualize each cohort’s retention rate at a specific point in their lifecycle, we can run a clear comparison between old customers and new—ensuring that the presentation of data accurately reflects the state of the business.