For those of you who have not read it, Alex Clayton at Meritech recently published his 2019 High Growth SaaS IPO annual review (linkhere). Given that at e.ventures, we make both SaaS and Consumer investments, I figured that it would be helpful to give a similar breakdown for the eight U.S. based Consumer Internet IPOs that occurred in 2019: Chewy, Peloton, Pinterest, The RealReal, Uber, Lyft, Smile Direct Club, and Revolve Group
2019 Review: High Growth Consumer Internet IPOs
Although there are many similarities in how one can compare Consumer IPOs to that of Alex’s work in SaaS, there are also many differences. For example, in our work below, we do not have data on implied payback period, as that is challenging to calculate in the Consumer Internet market without having raw transaction data (although some companies do report it).
As an alternative to that, we have provided an overview of each business’s sales and marketing efficiency, which we have done by comparing gross profit in a fiscal year to that of its sales and marketing spend.
One final note, due to market conditions, Chewy is the only business that is trading at a higher price than its IPO price. Just to keep in mind, these are massively successful businesses that have defied the odds of success. As I write on regularly, there are over 4,000 seed financed businesses each year in the U.S. alone, just to put these business’s performance in perspective.
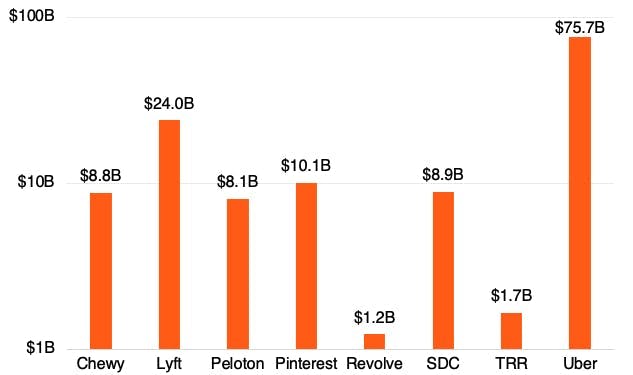
Market Cap at IPO
All eight businesses highlighted below were valued at over $1.2B at IPO. To put this in comparison, this is similar to that of the SaaS market, with DOMO having been the only new (of 16 total) SaaS IPO in 2019 to go public below a $1B market cap. Uber, of course, went public at an extraordinarily high price, largely due to the large amount of capital that they were able to raise in the private markets.
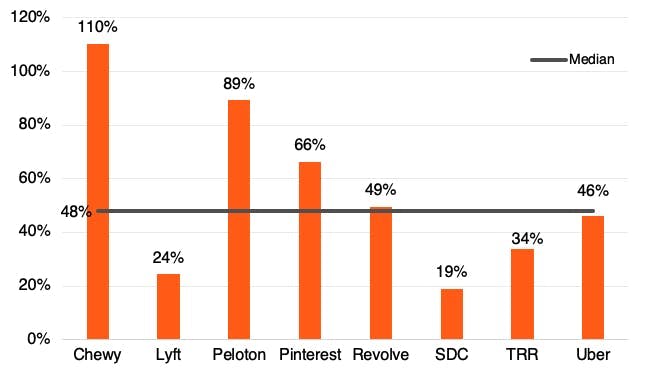
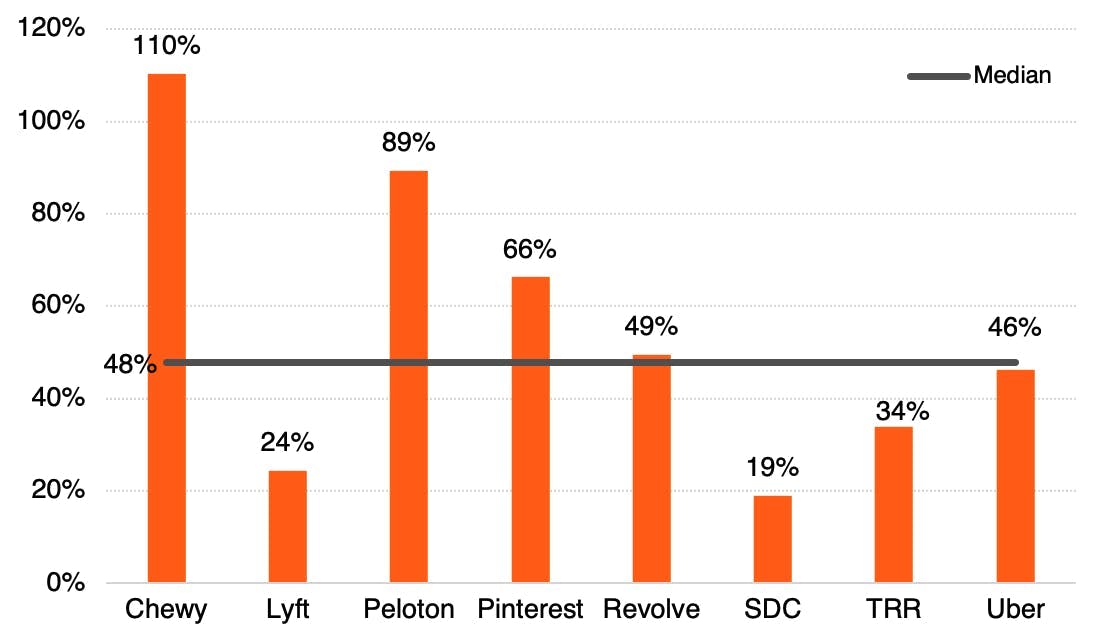
Current Market Cap Compared to the IPO Valuation
The median stock price, when compared to the IPO valuation of these businesses, is at 46%. Other than for Chewy, it has been a challenging stretch for Consumer Internet stocks since going public.
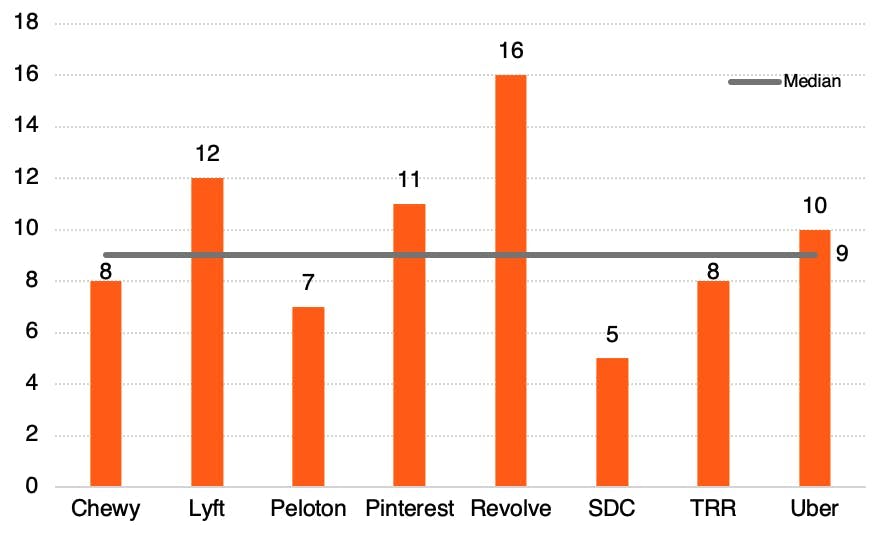
Years from Founding to IPO
The median years from founding to IPO was nine years. Smile Direct Club had a remarkable rise, having gone public in roughly five years since launching. Compared to that of the SaaS IPOs, the fastest company to IPO was eight years. Revolve is a major outlier and one could argue that Uber should have gone public faster. Lyft was a pivot from Zimride, which occurred in 2013.
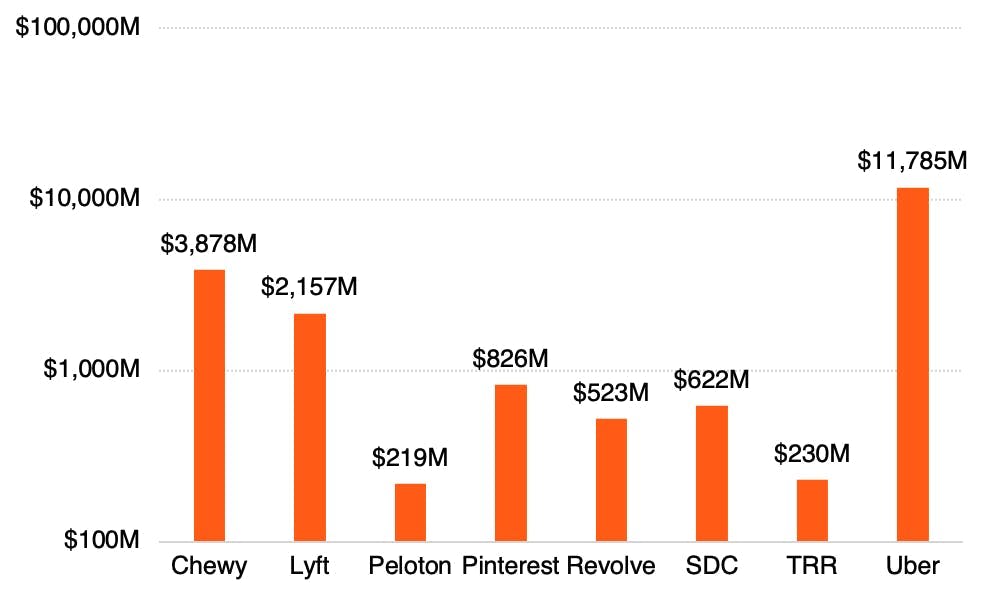
LTM Revenue at IPO Quarter
The disparity of LTM revenue across the group of companies is significant due to the sheer scale of Uber, which had $11.7B in LTM revenue. Following Uber, Chewy and Lyft were on a similar scale. The RealReal was the earliest of the eight, with only $230M. Just as a reminder, this is actual revenue, not Gross Merchandise Value (GMV). In Uber’s case, GMV (or what they call Gross Bookings) would be the total dollars of bookings, not just what they earn on them.
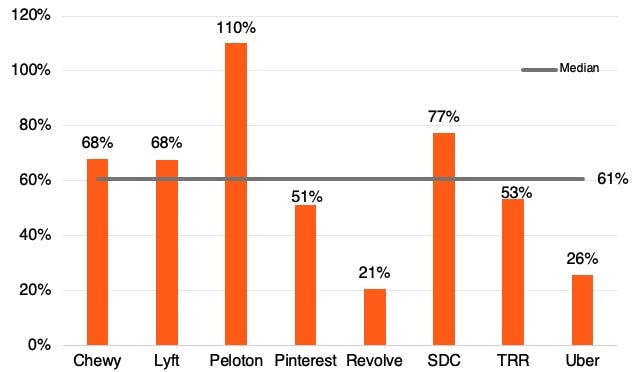
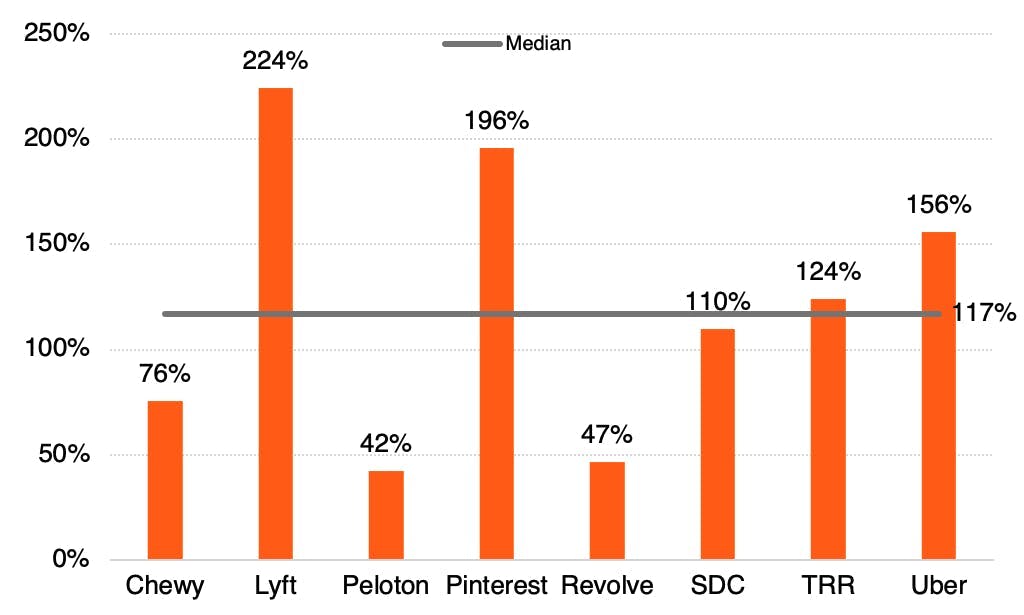
Total Revenue YoY Growth Rate
The median growth rate across this group was 61%, with Peloton leading the pack with 110% growth. Uber, the largest from a revenue perspective, was growing the least.
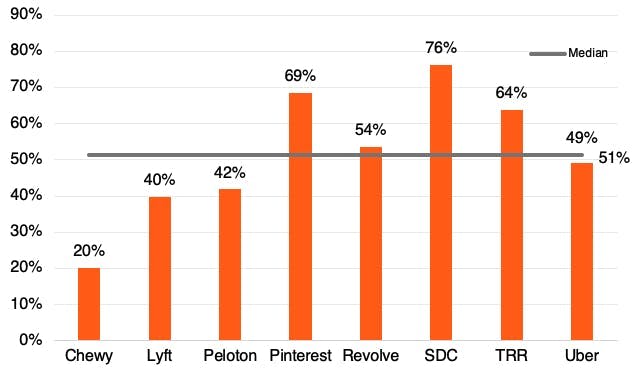
LTM GAAP Gross Margin
The median gross margin was 51%, with Chewy, Lyft, and Peloton pulling that down. Chewy, being a traditional ecommerce business, will likely never have much higher gross margins. Peloton will likely see rising margins as the mix of hardware to software sales shifts to the latter. These margins are vastly different than those of the SaaS businesses that IPOd in 2019, which had a median of 74.5%.
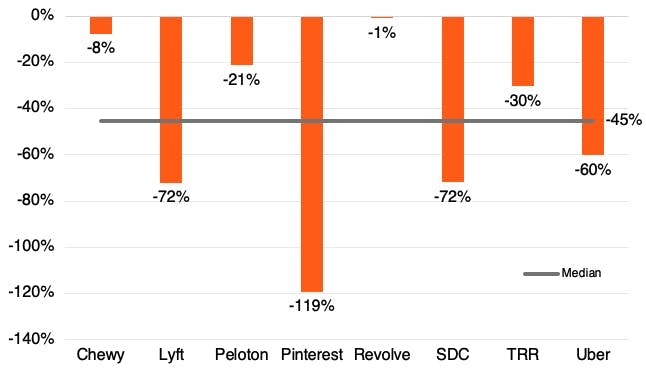
LTM Net Income Margin All of the eight businesses had burned capital in their final year up until the IPO. The median LTM net income margin was -45%.
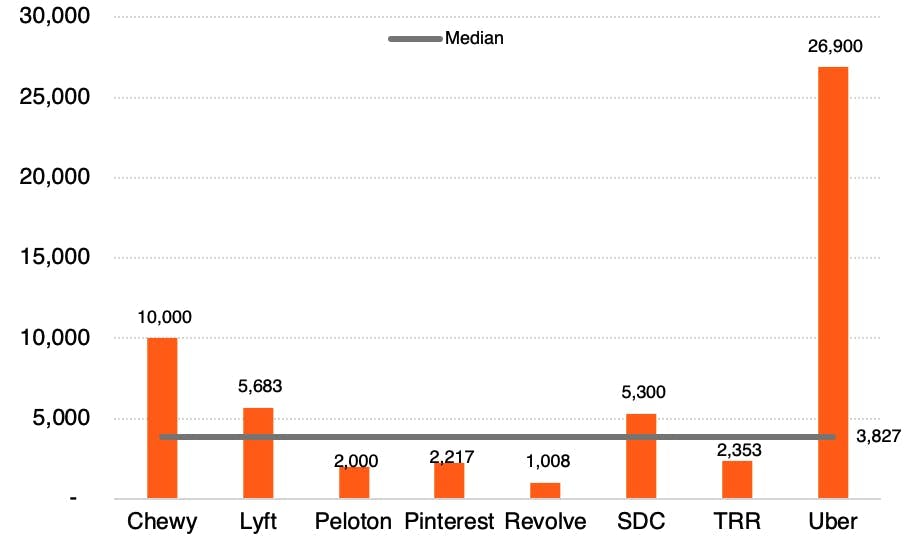
Total Full-Time Employees at IPO Quarter
The median FTE count at IPO quarter was over 3,000. Uber, by far and away had the most employees across this group. The smallest employer was Revolve Group with just over 1,000 employees. The median in SaaS was just over 1,100.
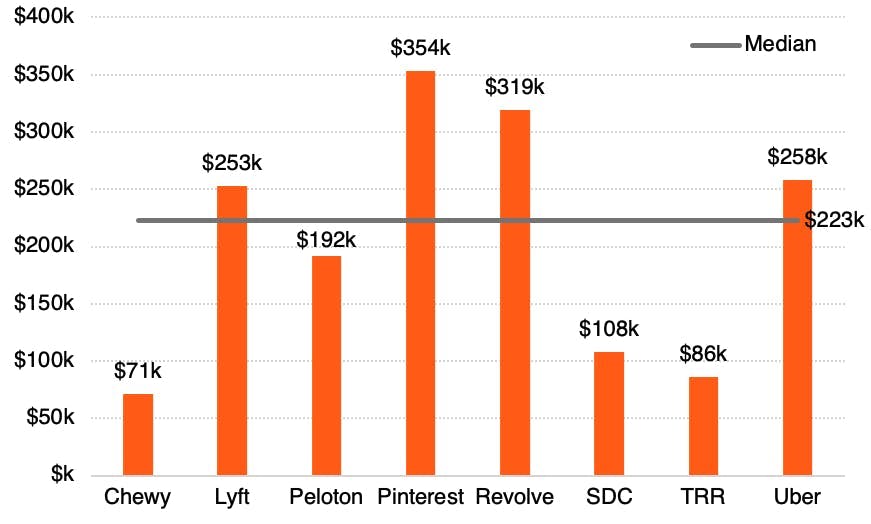
The median in SaaS was $223,000, which makes sense given the much higher gross margin. SaaS businesses tend to have a much tighter band across on this figure due to the margin consistency.
LTM Gross Profit Per FTE
In order to standardize a bit, we have broken the KPI above down by gross profit with the median being $223,000 in the last twelve months. The most efficient business in this group is the most digital of them all, Pinterest. When comparing this to SaaS businesses, at the median, these consumer businesses were able to drive over $56,000 more in gross profit per employee. The key thing here is that there is far more variance in the efficiency of consumer businesses, given the different types of business models (marketplace, hardware + subscription, ecommerce, social networking) compared to that of SaaS.
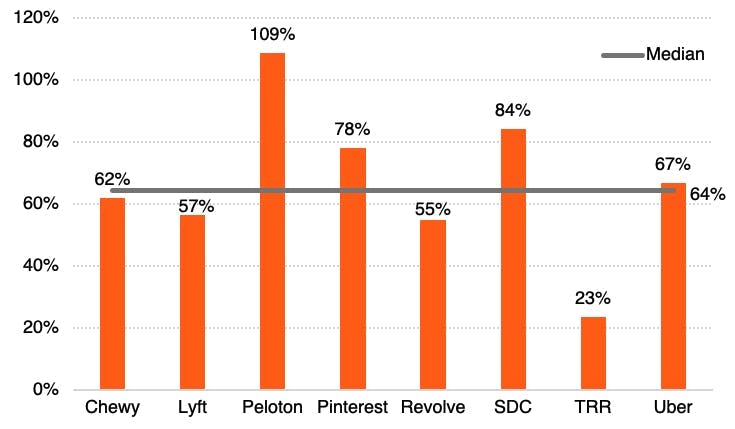
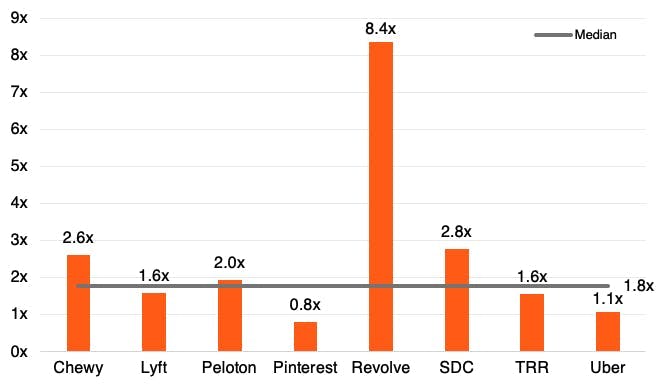
Gross Profit Compared to Sales and Marketing Spend
An alternative to implied payback period, which as discussed earlier is challenging to calculate without the raw transaction data, is the % of Sales and Marketing dollars spent within a time period compared to that of the Gross Profit generated in that time period. The median here is 64%, which means that $1 of gross profit is generated by spending $.64 in sales and marketing. The lower this figure, the higher the Sales and Marketing efficiency. The RealReal has the greatest customer acquisition efficiency here by far and away. Peloton, is the most inefficient, but they are also growing the fastest and are investing heavily in marketing spend. The easiest way to drive up sales and marketing efficiency at scale is to increase repeat purchase rates or to decrease marketing spend significantly.
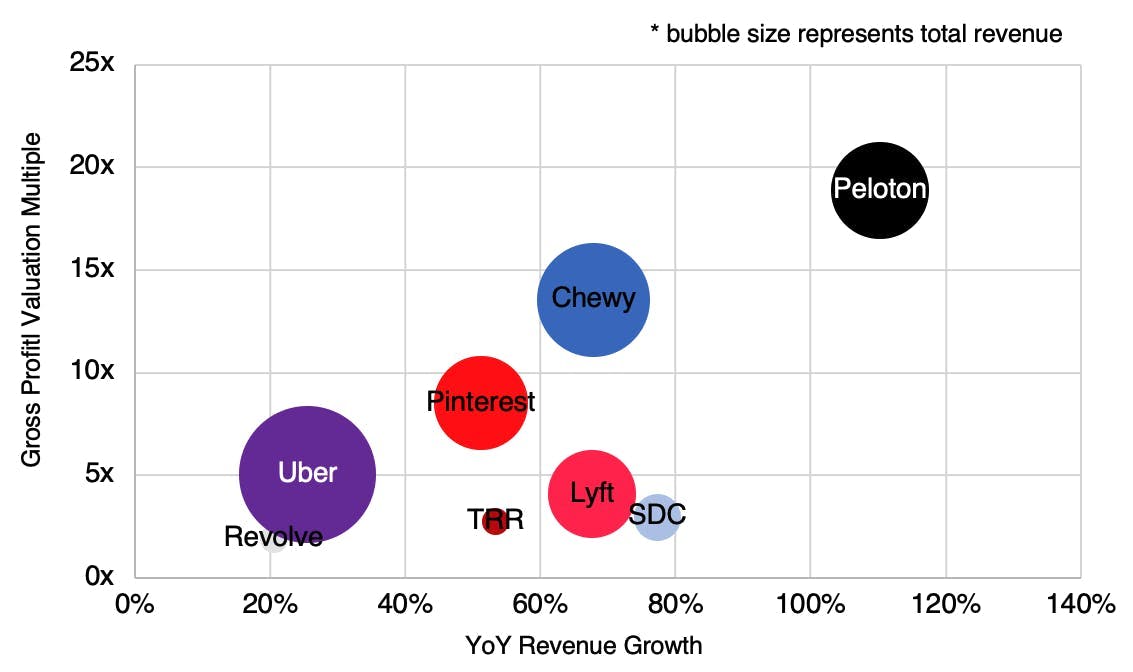
Gross Profit Valuation Multiple Compared to YoY Revenue Growth
We like to compare businesses based on a gross profit basis. Peloton is trading at a large premium due to its growth rate. Revolve on the other hand is getting penalized by the market for its slower growth (compared to its peers).
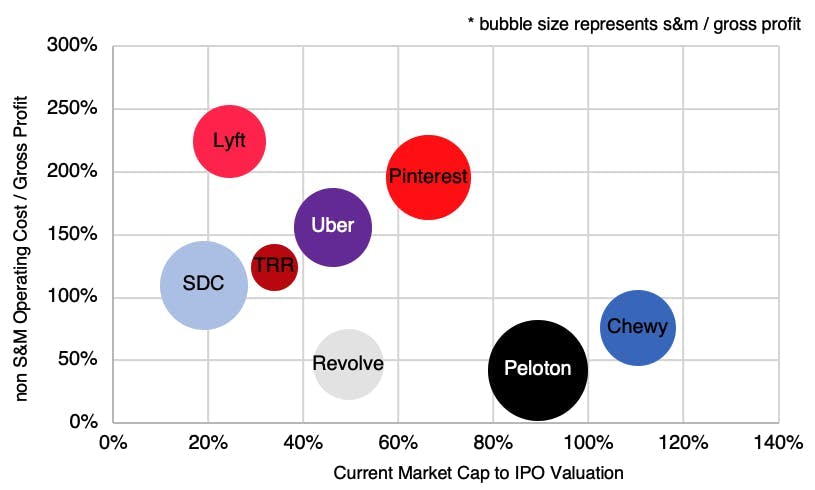
Gross Profit Compared to Non Sales and Marketing Operating Expenses
It is also important to review the non sales and marketing operating expenses in relation to the accumulated gross profit. As can be seen below, the majority of the eight businesses spend more than $1 in non S&M operating costs in order to drive $1 in gross profit. After deducting sales and marketing expenses, Lyft spends $2.24 for every dollar they drive in gross profit.
The below is calculated in this manner: (total operating expenses minus sales and marketing expenses) / (revenue minus cogs)
As can be seen below, those that spend the least on non S&M operating costs in relation to gross profit are currently performing their best in relation to their IPO Valuation.
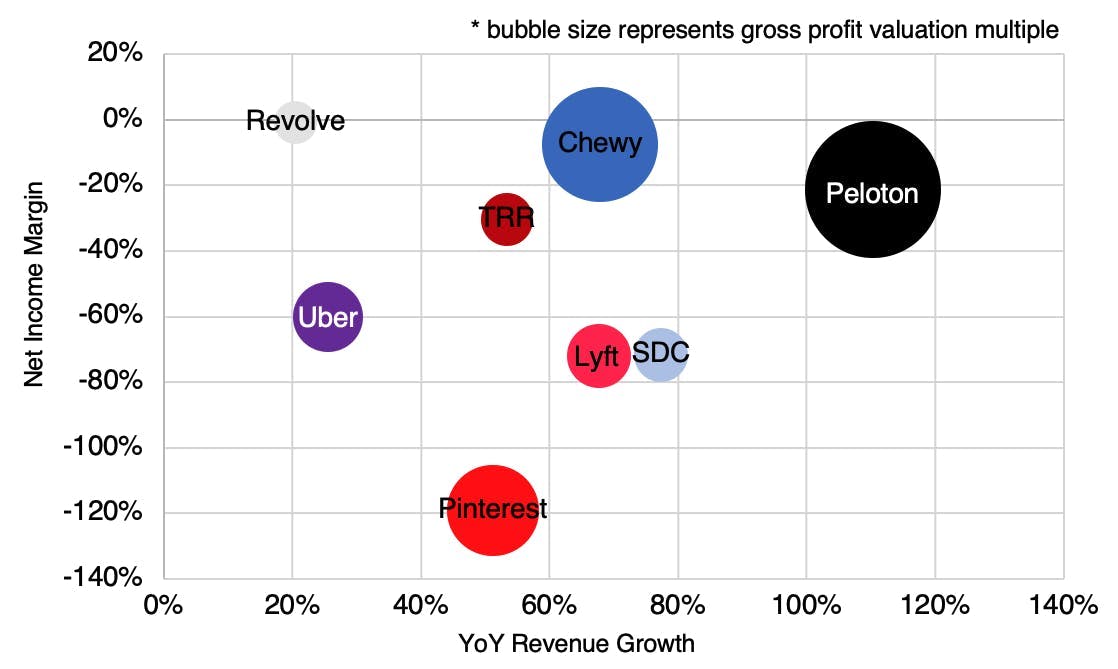
Net Income Margin Compared to YoY Revenue Growth
Most Consumer Internet businesses are still burning capital up until their IPOs as can be seen below. At the time of their IPO, Pinterest had burned more than they had generated in revenue in the prior year.
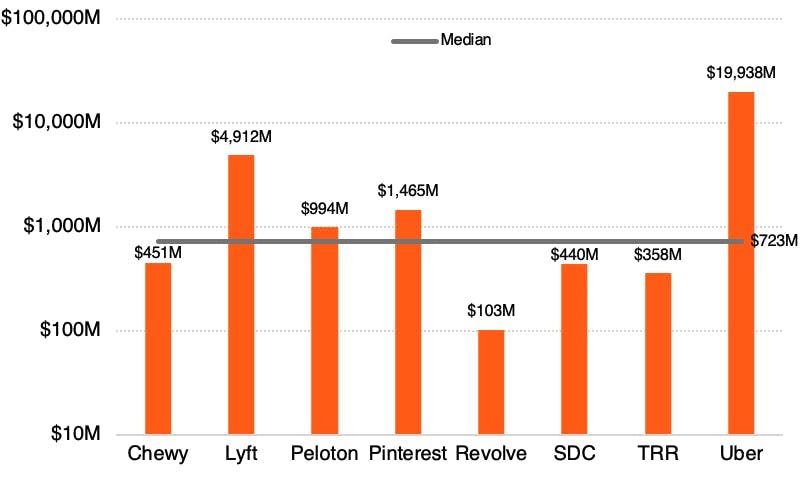
Total Equity Raised Prior to IPO
Given the tremendous disparity in capital raised across the group, please note the logarithmic scale below. When compared to enterprise software businesses, which rarely raise over $1B to go public (Workday was the only example in 2019), Consumer businesses have historically required far more capital, nearly twice as much in fact. One note, Chewy was acquired and then taken public, so well over $123M was likely invested into the business in order to go public.
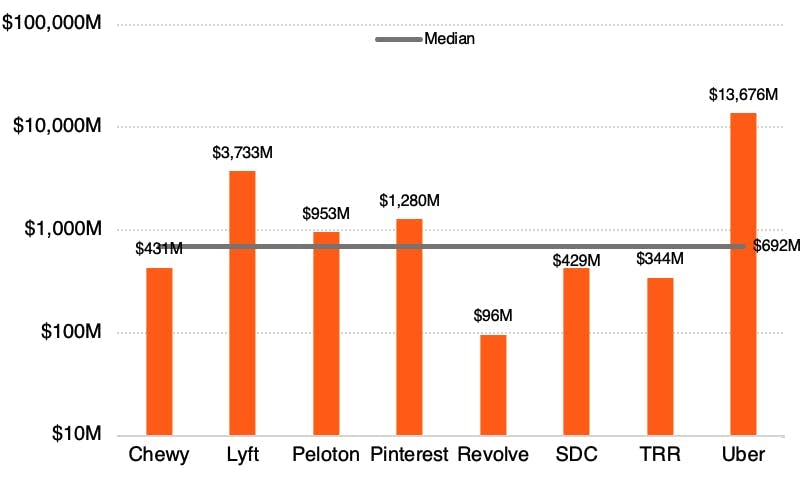
Implied Cash to Burn To IPO
As one would imagine, given the amount of capital raised, these businesses have all burned the vast majority of what they raised pre-IPO, with the median being $666M. Whereas the median SaaS business only burned $178M to go public.
Last Private Valuation Compared to IPO Valuation
The median increase from the last post-money valuation to the IPO valuation was 80%. Investors in Revolve and SDC saw the largest increases.
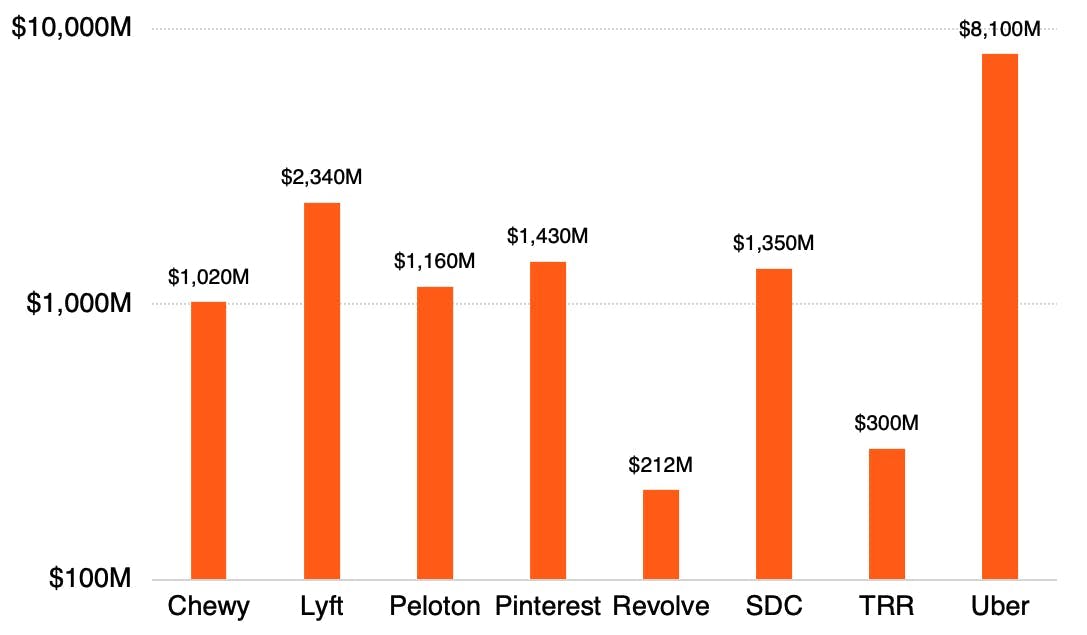
IPO Size
The median IPO size ended up being just over $1B. The median in SaaS was $374M by comparison. Zoom was the largest of that group with an $864M capital raise.
Post IPO Stock Performance
As of March 19th, all but Chewy are sitting at a valuation north of their IPO valuation. The median % of IPO market cap is at 48%. The Coronavirus has certainly impacted the performance. Chewy and Peloton are benefiting from the increase of remote work.
What did it take to go public as a consumer internet business in 2019?
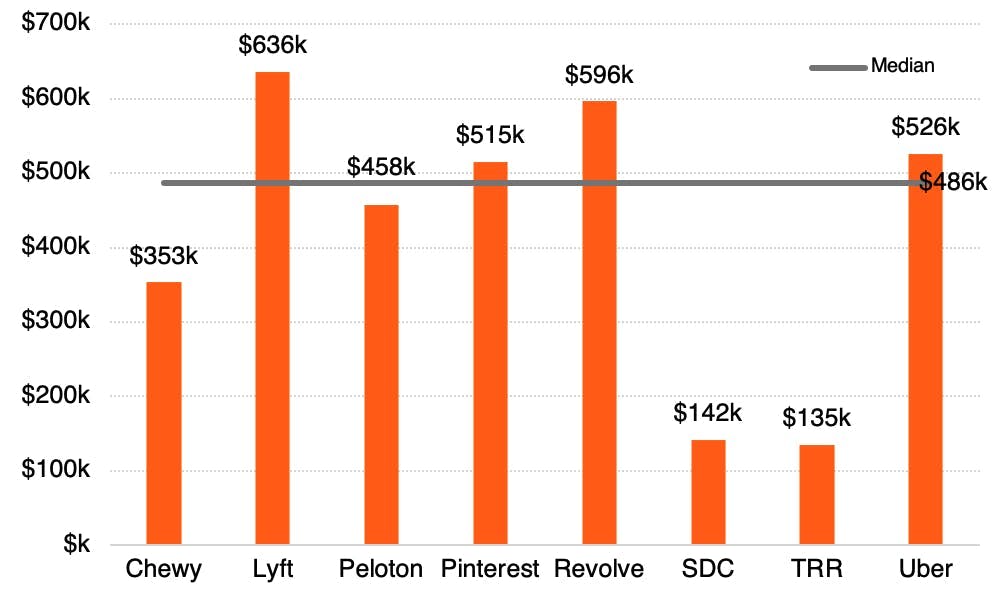
Once again, to take inspiration from Alex Clayton, in order to make it Public as a Consumer Internet company in 2019, you were founded ~9 years ago, have generated over $700M in revenue over the trailing twelve months and were growing over ~61% year-over-year, have 51% GAAP gross margins, have raised over $690M and have also burned over a $600M in capital, have spent 64 cents to generate 1 dollar of gross profit in the prior year, have over 2,000 full-time employees for which you generated over $480K in revenue per employee over the last year, and lastly have raised over $1B in your IPO.
To read weekly content on emerging internet startups, please subscribe here.
e.ventures (eventures.vc) is a global venture capital firm with offices in San Francisco, Berlin, Sao Paulo, Tokyo, and Beijing.