

“What’s your LTV-to-CAC ratio?”
If you’re a founder, odds are that you’ve heard this question many times before.
Businesses use Customer Lifetime Value (LTV) to evaluate their ongoing relationships with existing customers—arguably the most fundamental element to ensuring business sustainability. The calculation gauges the total amount of monetary value a business can expect to earn from a customer overtime. Customer acquisition cost (CAC), on the other hand, is the amount of money that a company spends to gain a new customer. This is the investment a founder management makes to grow the business.
Consequently, businesses can leverage their LTV-to-CAC ratio to determine the ROI dynamics of their growth spend as they gain new customer cohorts.
This is only becoming more important as spending slows across the board and VCs are looking for start-ups to demonstrate evidence of true growth potential before making any kind of investment decision. A data-driven pitch, especially one pulling an impressive LTV-to-CAC ratio, can catch the attention of investors looking for their next big opportunity.
While there’s no doubt that this metric is meaningful for businesses as they look to drive growth, there’s still room for improvement in how the industry measures what they hope to understand from this ratio.
Here’s how our team at Headline takes a more comprehensive approach to accurately evaluate customer worth.
The limitations of the traditional LTV calculation
Typically, LTV is calculated by multiplying the annual average revenue per customer by customer lifetime.
Say a company makes $1 million in annual revenue, supports a total of 100 customers, and has a customer lifetime of five years on average. In that case, for every customer, the business makes $10,000 per year. Theoretically, if you take the $10,000 and multiply it by five, the company should be able to get an idea of how much monetary value each customer can generate based on the length of time that they stay active with the business.
At Headline, we’ve identified two critical flaws with this method:
1. Calculating solely based on revenue promotes a gross representation of LTV.
This calculation doesn’t accurately reflect the true monetary value that a customer can generate over its lifetime, since it doesn’t take into account the cost of goods sold (COGS), i.e. the direct costs that go into producing the goods for the customer.
2. It incorrectly assumes a business’s customer churn rate is linear.
To calculate customer lifetime, it’s a rule of thumb for businesses to divide 1 by their annual churn rate. For example, if a business has an annual customer churn rate of 20%, customers are then expected to stay for five years on average (i.e., 1 divided by 20%). This calculation automatically assumes that the business loses 20% of its customer base every year (see Figure 1).
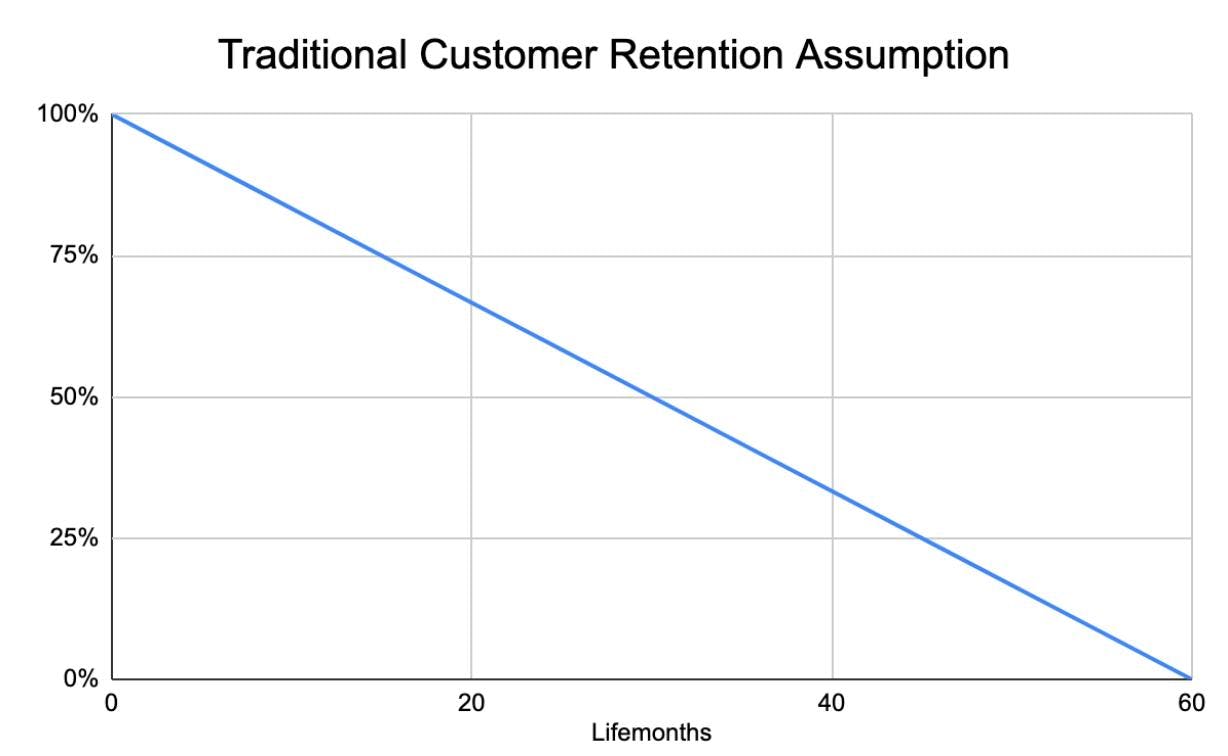
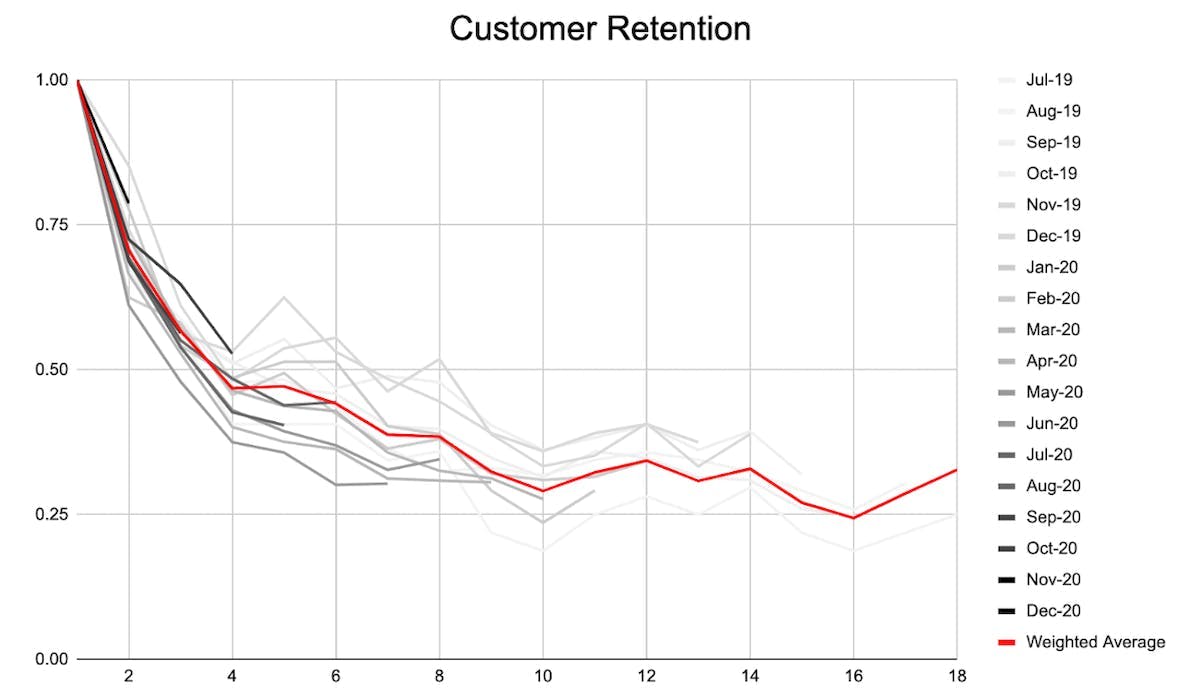
In reality, most businesses don’t experience a linear churn rate. In fact, customer retention behavior almost always resembles an asymptote, at least among successful businesses, meaning that most churn happens within the first few months a customer becomes active with a given service; after that point, it decreases each subsequent month to reach an eventual plateau.
This plateau, or point of asymptote, occurs when a customer has used the product or service long enough that it now relies heavily on the business for its daily processes and operations. It’s at this stage that a customer’s likelihood of churn declines and is mostly expected to remain with the business for the foreseeable future.
Customer lifetime varies widely and cannot be reduced to one number. Some even choose to remain with a business in perpetuity, making it difficult to assign a numeric value to the amount of time they spend using a given product or service. Think about how long you might have been a customer of Amazon or Netflix.
A new way to calculate LTV
At Headline, we’ve found a more reliable—and granular—calculation for LTV based on a two-step process. By finding the cumulative gross profit per customer, businesses can acquire a more accurate, nuanced understanding of the value that each of their existing customers can generate.
1. Leverage cohorts
Instead of simply calculating annual average revenue for all customers at once, we choose to bucket them into cohorts based on the month they first became active with the business, and tracking the amount of value that each customer in every cohort generates overtime.
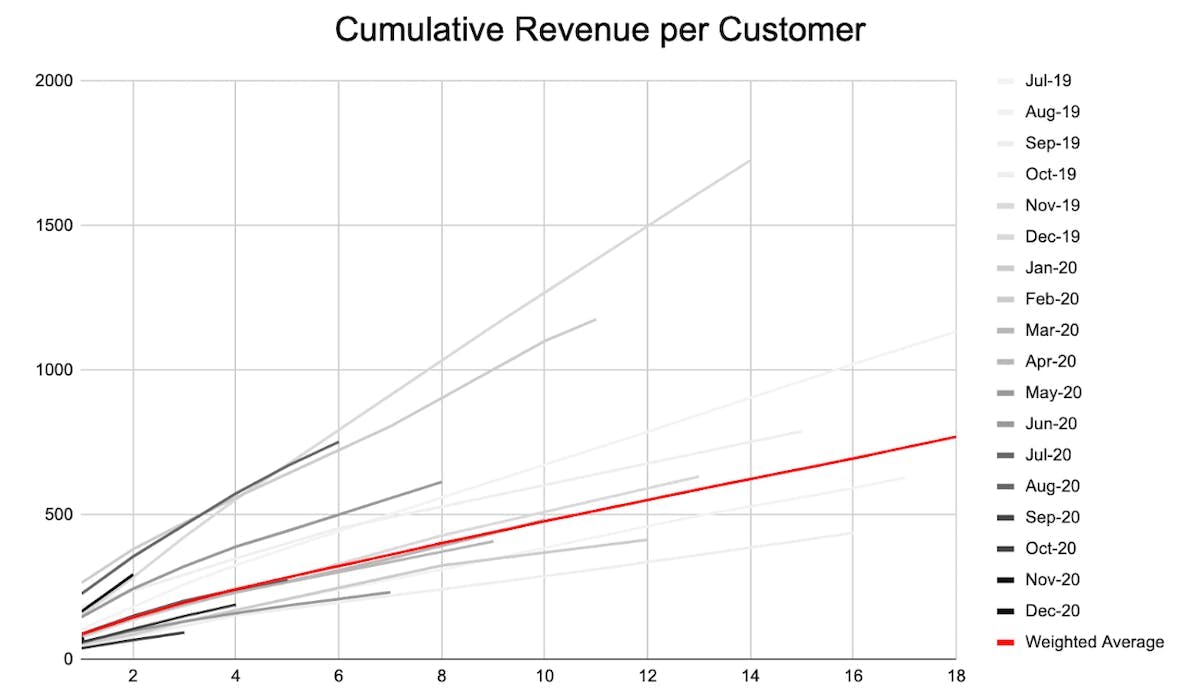
After calculating the revenue each cohort brings, we divide that by the total number of customers in that group. This gets us the cumulative revenue that each customer has generated for the business—in other words, the cumulative revenue per customer (see Figure 3).
2. Account for direct costs
To get the actual (net) LTV, we multiply the cumulative revenue per customer by the gross margin that the business operates at. This is an important step, as it helps us take into account the cost of goods sold (COGS). Whereas the traditional formula for LTV will only look at revenue, Headline’s updated approach takes a more holistic view of a customer’s worth by factoring in costs.
Armed with this knowledge, companies can adjust their CAC to improve business sustainability.
Determine True ROI by Finding the ‘Core Ratio’
To determine a business’s accurate ROI on customer acquisition, we need to go a step further by calculating both the cumulative gross profit per customer and their acquisition cost to see whether the growth spend is a worthwhile investment.
Historically, businesses have calculated their ROI on customer acquisition by taking their LTV and dividing it by CAC. At Headline, however, we take the cumulative gross profit per customer of a cohort as it matures and scales with a business overtime—our more holistic approach to LTV—and divide that by the CAC it took to acquire that same cohort, usually the total sales and marketing spend a business had of a given cohort’s month. We call this the “Core Ratio,” as it represents the core growth engine of a business.
This approach enables us to determine whether the ROI dynamics of a business’s growth spend is becoming more or less efficient as the business acquires new customer cohorts overtime.
The data series in Figure 4, for example, represents the Core Ratio across multiple customer cohorts from lifemonth 0 to lifemonth 18. After surpassing value 1 on the Y-axis, we assume that the cohorts have already generated back the funds that the business invested to acquire them. This is the point in which the cohorts’ cumulative gross profit per customer equals their CAC.
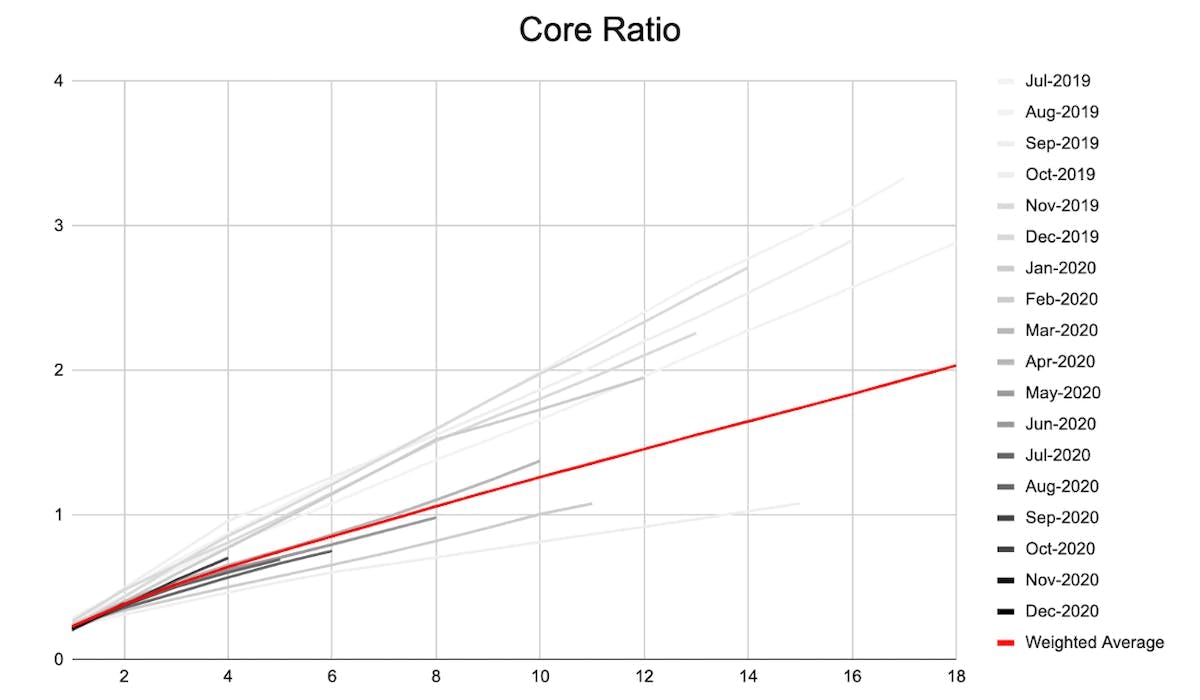
Note that we’ve color-coded the data points to illustrate different maturity levels between customer cohorts, as indicated in Figure 2-4. The more recently acquired customer cohorts are depicted darker than the rest.
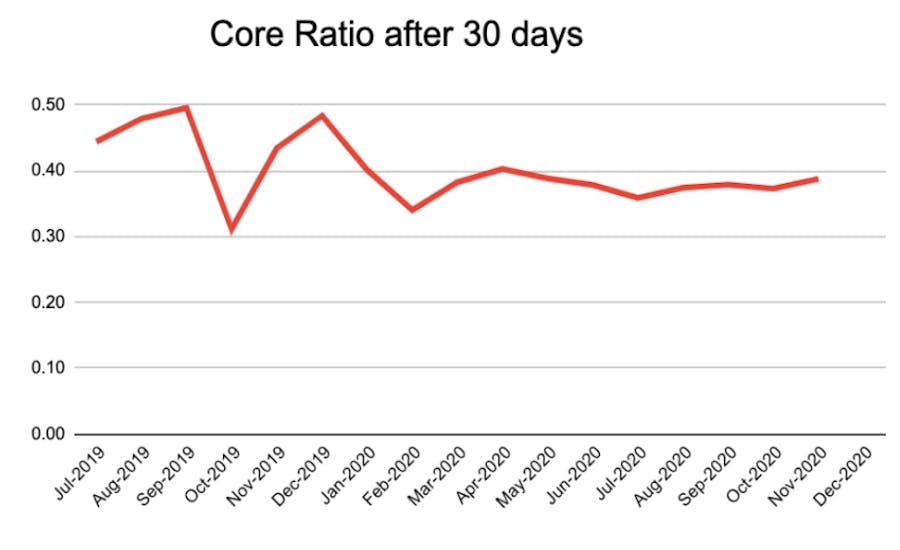
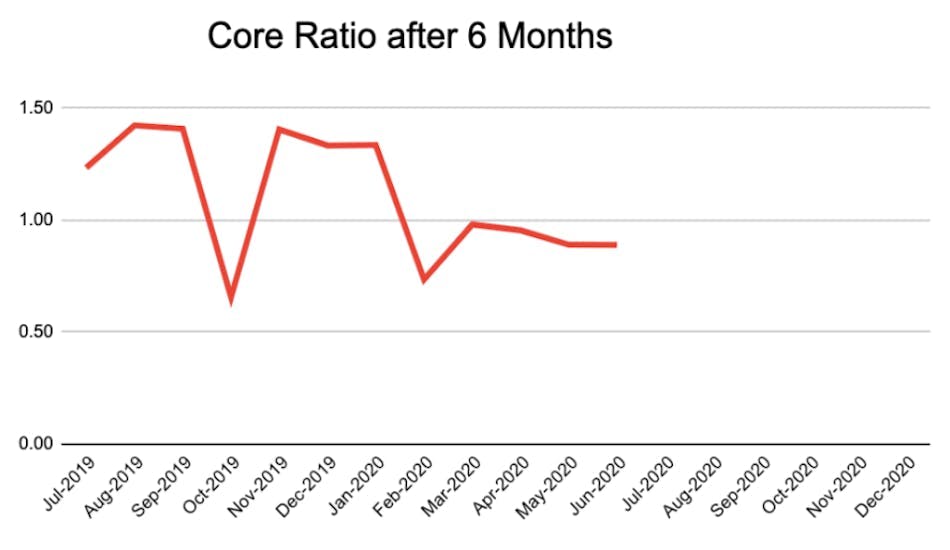
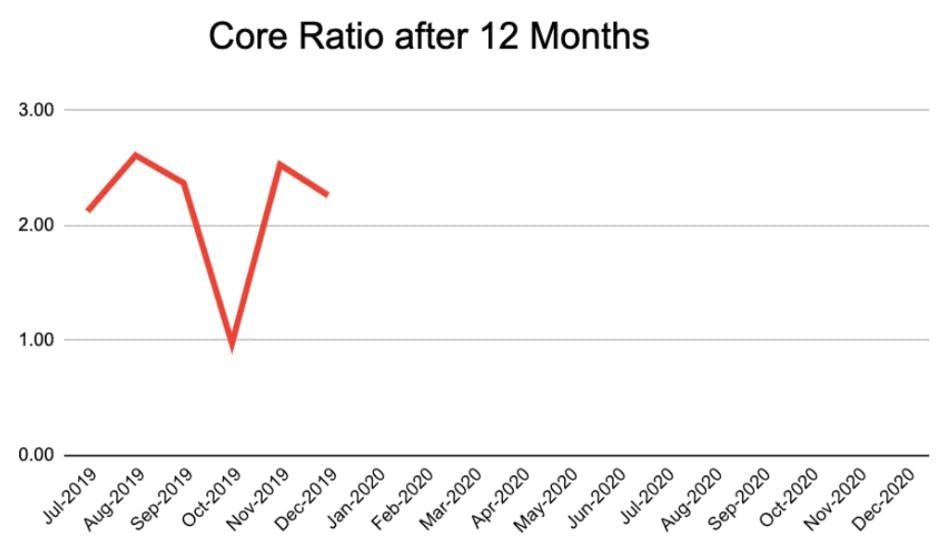
To control for differences in cohort maturity, we also use sidecuts—a type of static plot—to evaluate Core Ratio performance across different customer cohorts at a specific stage in their lifecycle. By choosing a certain point in time, such as the first 30 day mark, we can analyze ROI performance for all cohorts comprehensively, regardless of how long each of them have stayed active with the business (see Figure 5-7).
Let your Core Ratio speak for itself
When looking to determine the amount of value a customer can potentially bring to a business, the LTV-to-CAC ratio is an incredibly important metric—but like any other common calculation methods, it’s easy to wind up with inaccurate results.
By leveraging customer cohorts, evaluating cumulative changes in revenue overtime, accounting for cost of goods sold (COGS), and implementing the Core Ratio, you can achieve more reliable insight into your business’s expected ROI on CAC.
Nicolas von Blottnitz is an investor at Headline. To learn more about his data-first approach, check out his article on product-market fit.